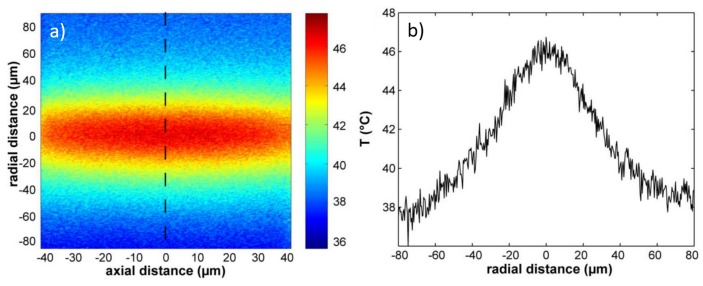
Figure 19.
Spatial temperature profile in an optical stretcher. (a) Color image of the temperature increase from the two opposing laser beams in the optical stretcher. The imaging plane is the channel cross section through the center of the trap and the power of each laser beam is 1 W; (b) Line scan of the temperature along the dashed line in (a). Figure reproduced from Reference [71] with permission from Optical Society of America.

