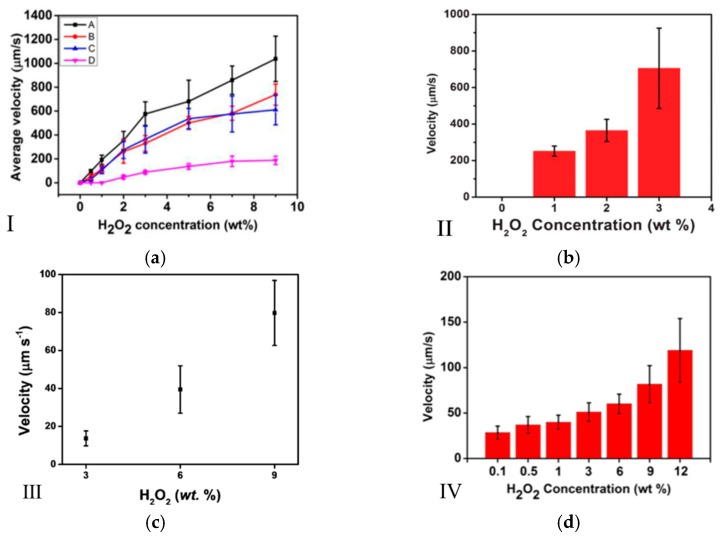
Figure 2.
The relationship between the concentration of H2O2 and micromotors of different shapes. (a) The dependence of the average velocity of the four type of tubular micromotors on the concentration of H2O2 [59]. (A. Electrodeposited in 5 μm pores; B. Electrodeposited in 2 μm pores; C. Electrodeposited in 2 μm pores (shorter deposition time); D. Electrodeposited in 200 nm pores.) (b) The relationship between the average velocities of microjets and the concentration of fuel [53]. (c) The dependence of the velocity of Janus Ag micromotors on the hydrogen peroxide concentration [60]. (d) The relationship between the average velocity of Ag catalytic micromotors on H2O2 concentration at 23 °C [61]. Reproduced with permission from [53,59,60,61].

