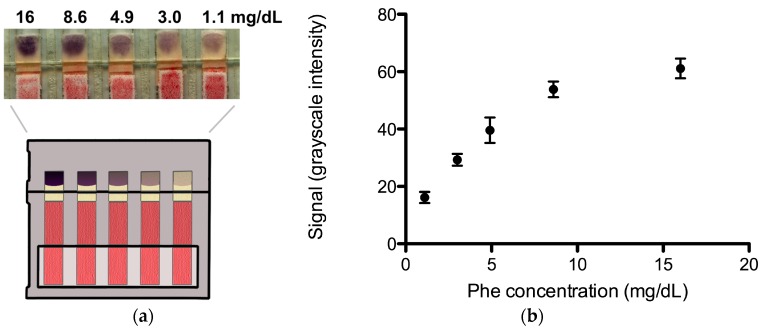
Figure 4.
Paper-based whole blood Phe monitor. (a) Image data of a concentration series of Phe spiked into whole blood; (b) The plot shows the Phe concentration vs. signal (mean grayscale intensity) for N = 6 replicates. The error bars represent standard error. See Methods for details on the grayscale intensity scale.

