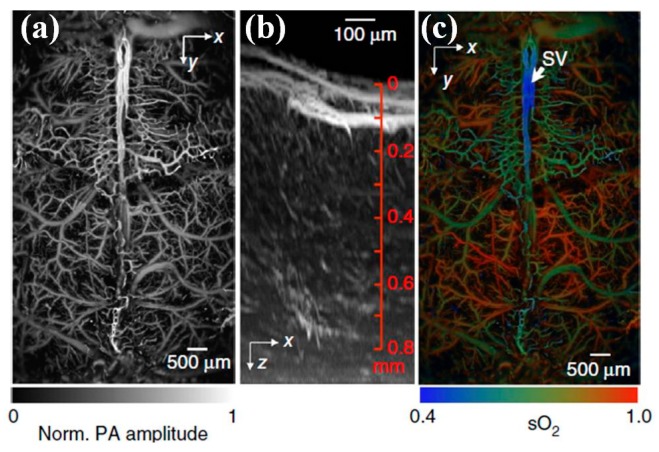
Figure 20.
Photoacoustic in vivo imaging of the mouse brain. (a) Representative x-y projected brain vasculature image through an intact skull (n = 6). (b) Representative enhanced x-z projected brain vasculature image acquired over a 0.6 × 0.6 mm2 region with depth scanning, where the signal amplitude was normalized depthwise (n = 6). (c) PAM of oxygen saturation of hemoglobin (sO2) in the same mouse brain as in (a), acquired by using the single-wavelength pulse-width-based method (PW-sO2) with two lasers. SV, skull vessel (Reproduced with permission from Nature Publisher Group [112]).

