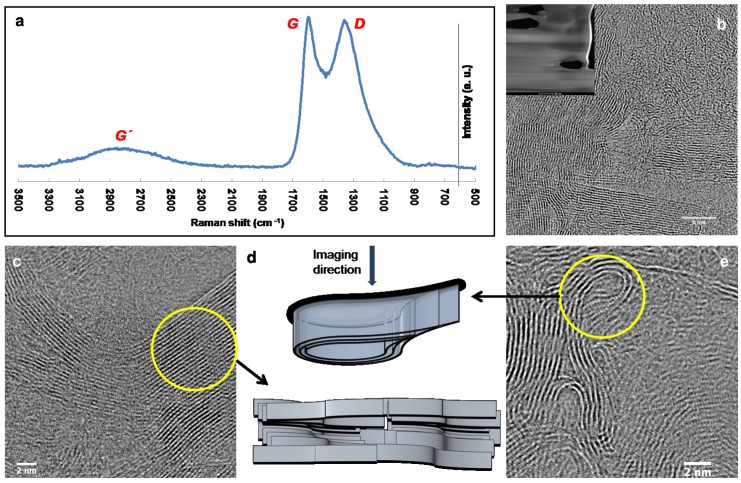
Figure 4.
Microstructural characterization of IP-Dip-derived glassy carbon. (a) Raman spectrum; (b) Transmission Electron Microscopy (TEM) image showing the microstructure observed in the majority of the material (inset: Focused Ion Beam (FIB) milled sample used for TEM analysis); (c) TEM image featuring a graphitizing region; (d) Pictorial representation of possible 3D arrangement of graphene sheets in the material (locations highlighted by circles); (e) TEM image featuring strongly folded graphene sheets. Scale bars: (b) 5 nm; (c,e) 2 nm.

