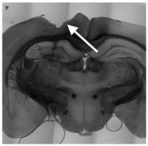
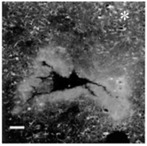
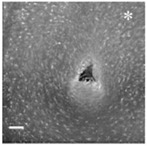
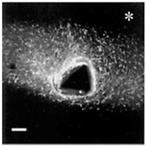
Table 1.
Summary of potential causes of damages, nature of the incurred damage, and solutions to minimize the damage in chronological order of implantation *.
| Stage | Before Implantation | During Implantation | Post-Implant (<1 Week) | Post-Implant (>1 Week) |
|---|---|---|---|---|
| In vivo procedure | Acute |  |
Chronic | |
 |
 |
 |
 |
|
| Schematic view |  |
 |
 |
 |
| Potential causes of damage |
|
|
|
|
| Induced effects |
|
|
|
|
 |
 |
 |
 |
|
| Results |
|
|
|
|
| Proposed solutions |
|
|
|
|
* Reproduced with permission from Szarowski et al. [75]. A scale bar of 100 μm.
