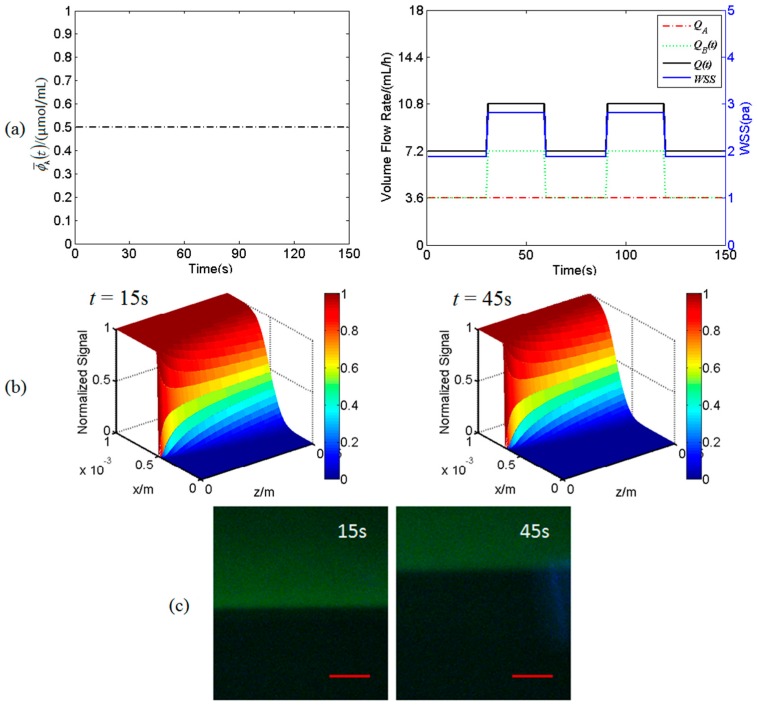
Figure 3.
An input static fluorescent signal and its spatiotemporal concentration profile in a dynamic flow in the mixing micro-channel C. (a) The static fluorescent signal , the volume flow rates QA, QB(t), Q(t) and wall shear stress (WSS); (b) numerically simulated concentration profile at t = 15 s and t = 45 s in x-z plane, respectively; (c) experimental concentration profiles at t = 15 s and t = 45 s in x-z plane, respectively. Scale bar is 100 μm.

