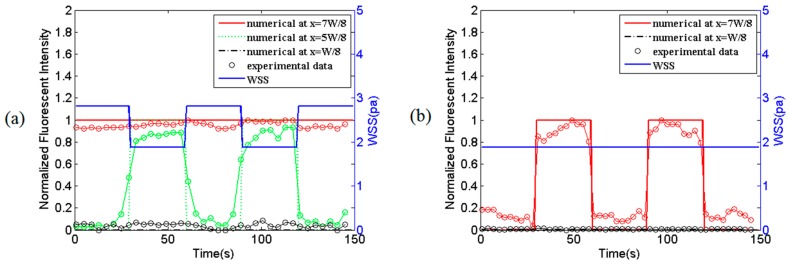
Figure 5.
Comparison between simulation results and experimental data of combined WSS and fluorescent signals at different locations at z = 2 cm in the mixing micro-channel C. (a) Static fluorescent signal under dynamic flow; (b) dynamic fluorescent signal under steady flow. All the signals are normalized to a constant reference value.

