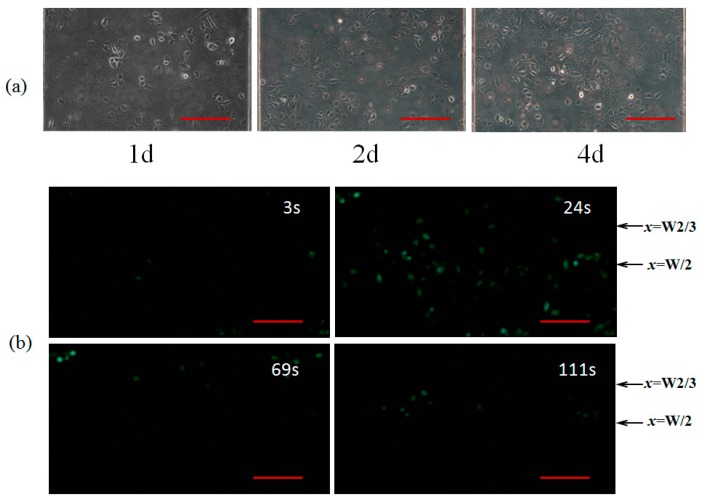
Figure 6.
The intracellular Ca2+ response in the human umbilical vein endothelial cells (HUVECs) culture on the bottom of the mixing micro-channel C at z = 2 cm. (a) HUVECs cultured for 1d, 2d and 4d, respectively; (b) the intracellular Ca2+ intensity at t = 3 s, 24 s, 69 s, and 111 s, respectively. Scale bar is 100 μm.

