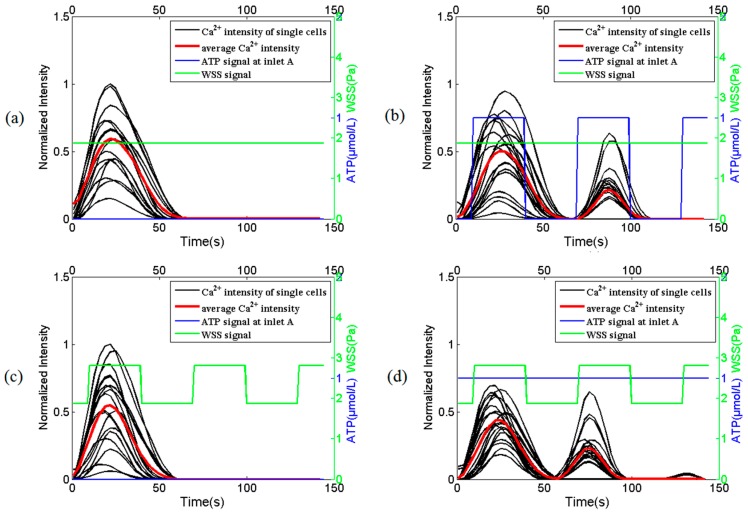
Figure 7.
The intracellular Ca2+ dynamics in HUVECs in response to WSS signal alone and combined WSS and adenosine triphosphate (ATP) signals. (a) static WSS signal alone and (b) static WSS signal with dynamic ATP signal at the religion of x = W/8 or x = W7/8 in mixing micro-channel C under the condition that volume flow rate is constant, respectively; (c) dynamic WSS signal alone and (d) dynamic WSS signal with static ATP signal at the religion of x = W/8 or x = W7/8 in mixing micro-channel C under the condition that volume flow rate is dynamic changing, respectively. Experimental data in (a,b) are measured from one group of HUVECs while those in (c,d) are measure from another group of HUVECs. The average Ca2+ intensity is the average value of 20 single cells. All the data are normalized to a constant reference value.

