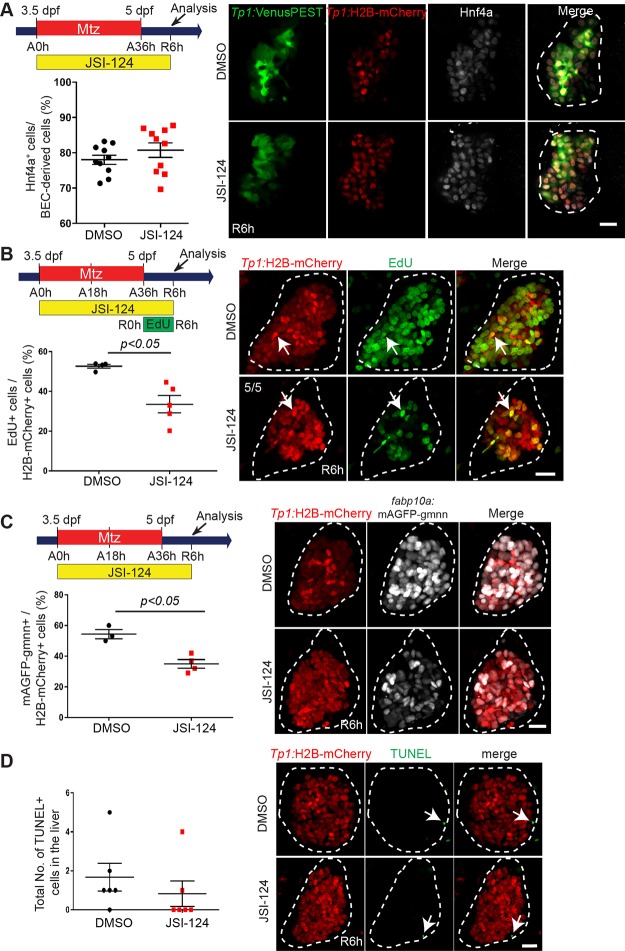
Figure 2.
Stat3 inhibition reduces liver size due to an LPC proliferation defect in regenerating livers. (A) Confocal projection images showing the expression of Tp1:VenusPEST (green), Tp1:H2B-mCherry (red), and Hnf4a (gray) in regenerating livers at R6h. Quantification of the percentage of Hnf4a+ cells among biliary epithelial cell (BEC)-derived cells (H2B-mCherry+ cells) in regenerating livers is shown. (B) Confocal projection images showing Tp1:H2B-mCherry (red) expression and EdU (green) staining in regenerating livers at R6h. Quantification of the percentage of EdU+ cells among Tp1:H2B-mCherry+ cells (arrows) in the liver is shown. Numbers in the top left corner indicate the proportion of livers exhibiting the representative phenotype at R6h. (C) Confocal projection images showing Tp1:H2B-mCherry (red) and fabp10a:mAGFP-gmnn (gray) expression in regenerating livers at R6h. Quantification of the percentage of mAGFP-gmnn+ cells among Tp1:H2B-mCherry+ cells is shown. (D) Confocal projection images showing Tp1:H2B-mCherry (red) expression and terminal deoxynucleotidyl transferase dUTP nick-end labeling (TUNEL; green) staining (arrows) in regenerating livers at R6h. Quantification of the total number of TUNEL+ cells per liver at R6h is shown. Dashed lines outline regenerating livers. Scale bars: 20 μm; error bars: ± SEM.

