Figure 4.
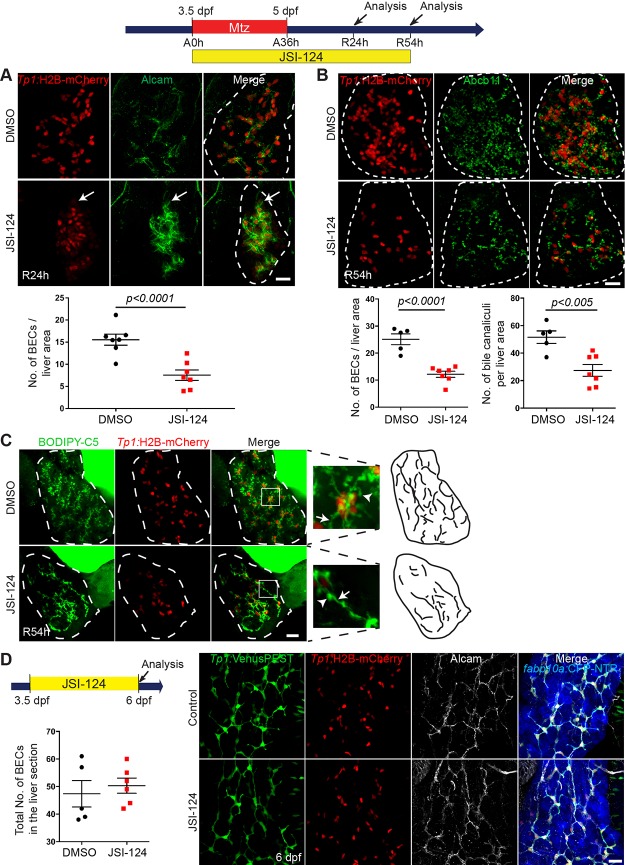
Stat3-inhibited livers maintain low BEC numbers and display aberrant intrahepatic biliary structure. (A) Confocal projection images showing Tp1:H2B-mCherry (red) and Alcam (green) expression in regenerating livers at R24h. Quantification of the number of BECs (Alcam/H2B-mCherry double-positive cells) per liver is shown. For the count of BECs, the total number of BECs in the whole liver is divided by the liver area. Arrows point to weak H2B-mCherry+/Alcam+ cells, which were more prevalent in JSI-124-treated livers compared to controls. (B) Confocal projection images of regenerating livers at R54h showing Tp1:H2B-mCherry (red) and Abcb11 (green) expression. Quantification of the number of BECs (H2B-mCherry+ cells) and bile canaliculi per liver area is shown. (C) Confocal projection images showing BODIPY C5 staining (green) and Tp1:H2B-mCherry expression (red) at R54h. Inset boxes show a magnified image of the selected area. Arrows point to bile ductules; arrowheads point to bile canaliculi. (D) Confocal projection images showing the expression of Tp1:H2B-mCherry (red), Tp1:VenusPEST (green), fabp10a:CFP-NTR (blue), and Alcam (gray) in nonablated livers treated with DMSO or JSI-124. Quantification of the number of BECs (Alcam+/H2B-mCherry+ cells) per liver is shown. Dashed lines outline regenerating livers. Scale bars: 20 μm; error bars: ± SEM.

