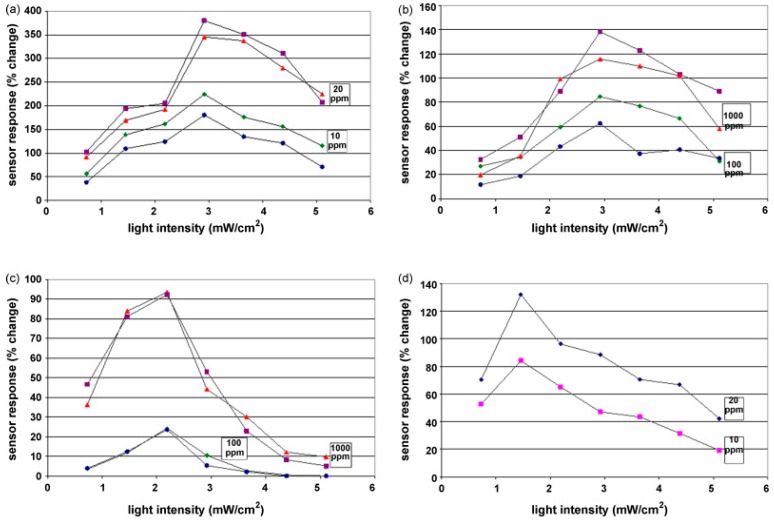
Figure 3.
Sensing response (% change in the baseline current) vs. light intensity . Two different sensors based on ZnO were exposed to (a) hexane; (b) propane; (c) methane; (d) ethanol vapors of different concentrations. Reproduced with permission from [38].

