Fig. 6.

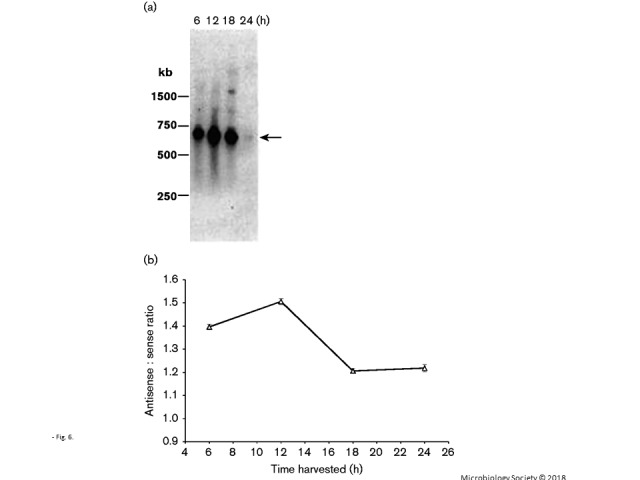
pilE RNA expression over time. (a) Northern blot of total RNA samples isolated from liquid-grown cells at the indicated time points. The total RNAs from each time point were quantified by spectrophotometric analysis and equal amounts of RNA were applied to the gel. The blot was probed with oligonucleotide probe 245, which recognizes pilE sense RNA at the 5′ end (Wachter et al., 2015). The arrow indicates the full-length pilE message. (b) Antisense : sense ratio of pilE RNA. The strand-specific Ct values were determined through qRT-PCR. The initial strand-specific cDNA was made using primer 09172 for antisense expression and primer 09085 for sense expression. As a Ct value is inversely related to the extent of expression, the higher the ratio that is observed, the more sense expression is apparent when compared with antisense expression. Error bars represent mean ± sd; n = 4.
