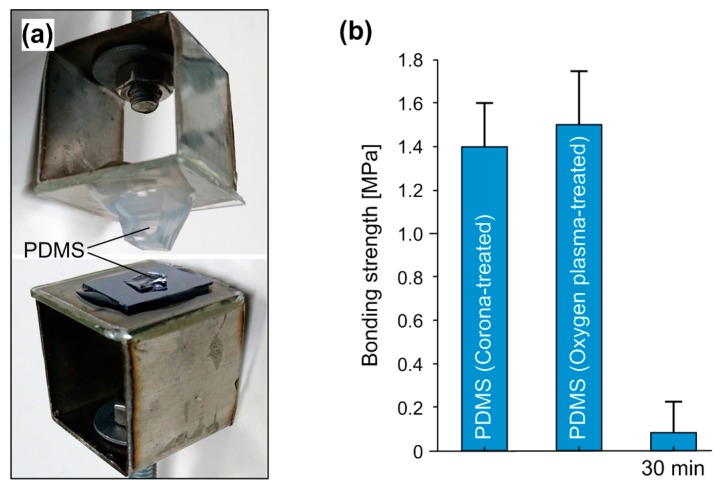
Figure 5.
Tensile strength test for the PDMS-SU-8 bonding. (a) Photo of a broken sample after the tensile test; (b) bonding strength of samples treated under different conditions: corona-activated PDMS, oxygen plasma-activated PDMS and 30-min-aged PDMS and SU-8 after APTES silanization. Error bars represent the standard deviation of seven measured samples under each condition.

