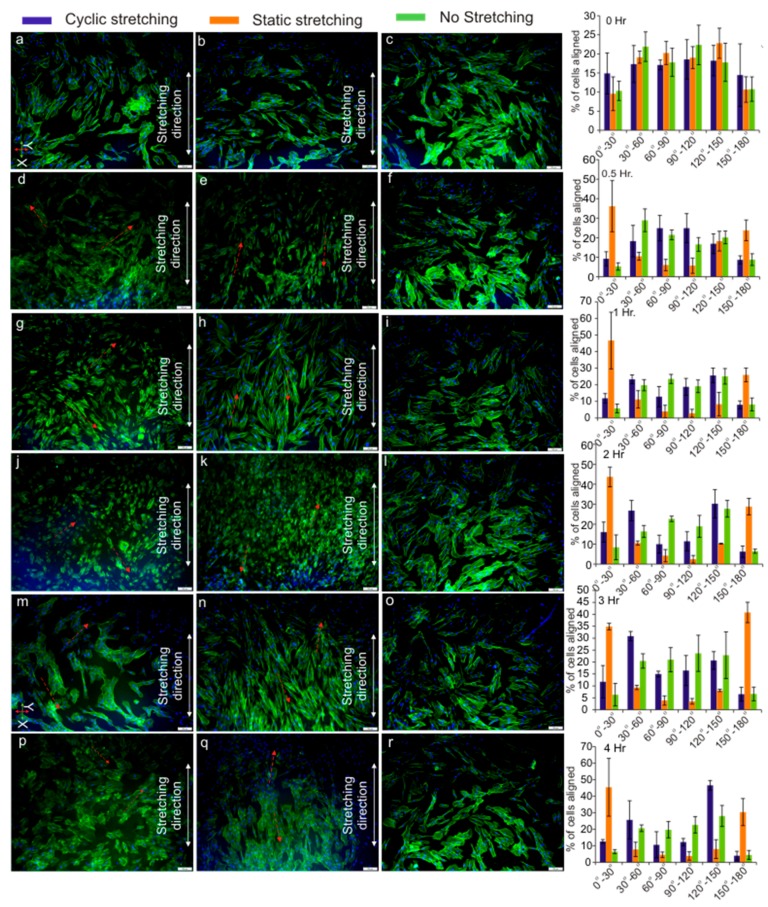
Figure 7.
Cell orientation analysis results for cyclic stretching (1.4%, 0.01 Hz, 50% Duty Cycle), static stretching (1.4%), and no stretching conditions at 0 h, 0.5 h,1 h, 2 h, 3 h, and 4 h. (Inset: fluorescent images of the fibroblast cells with 10× objective for (a–c) 0 h; (d–f) 0.5 h; (g–i) 1 h; (j–l) 2 h; (m,n) 3 h; and (p–r) 4 h with 100-µm scale bar).

