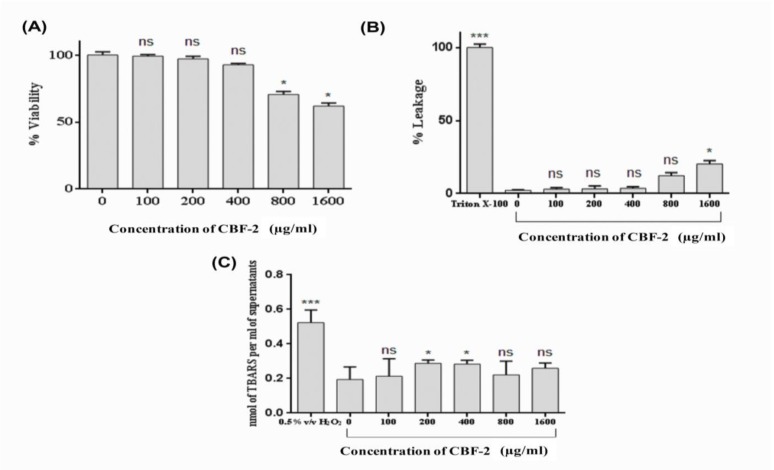
Figure 8.
Cytotoxicity analysis of CBF-2. (A) MTT assay (B) LDH release and (C) Estimation of TBARS levels. The data was expressed as mean±SD (n=6). The results were analyzed by one way ANOVA with Dunnett’s multiple comparison posttest. Comparisons were performed vs Control (CBF-2, 0.0 μg/ml). (ns: not significant) (*** p<0.001 and *p<0.05).

