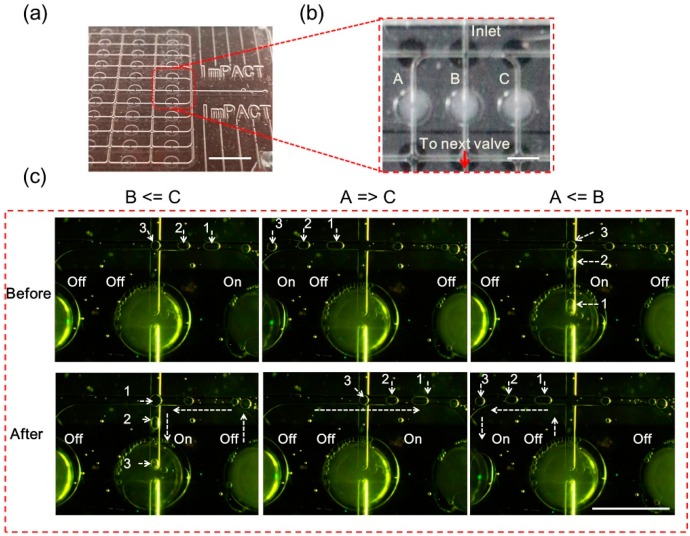
Figure 8.
Demonstration experiment of channel selection using valves. (a) Photo of the microfluidic device prototype; (b) The location of the observed area and valve units used; (c) Results of the channel selection demonstration. B ≤ C before: initial state of valve A, off; B, off; C, on; positions of bubbles 1, 2, and 3 in the flow. B ≤ C after: B was turned on, and A and C were turned off; the flow containing bubbles flowed to B. A ≥ C before: initial state of valve A, on; B: off, C, off; the positions of bubbles 1, 2, and 3 in the flow. A ≥ C after: C was turned on, and A and B were turned off; the flow containing bubbles flowed to C. A ≤ B before: initial state of valve A, off; B, on; C, off; the positions of bubbles 1, 2, and 3 in the flow. A ≤ B after: A was turned on, and B and C were turned off; the flow containing bubbles flowed to A. The white scale bar is 1.5 mm.

