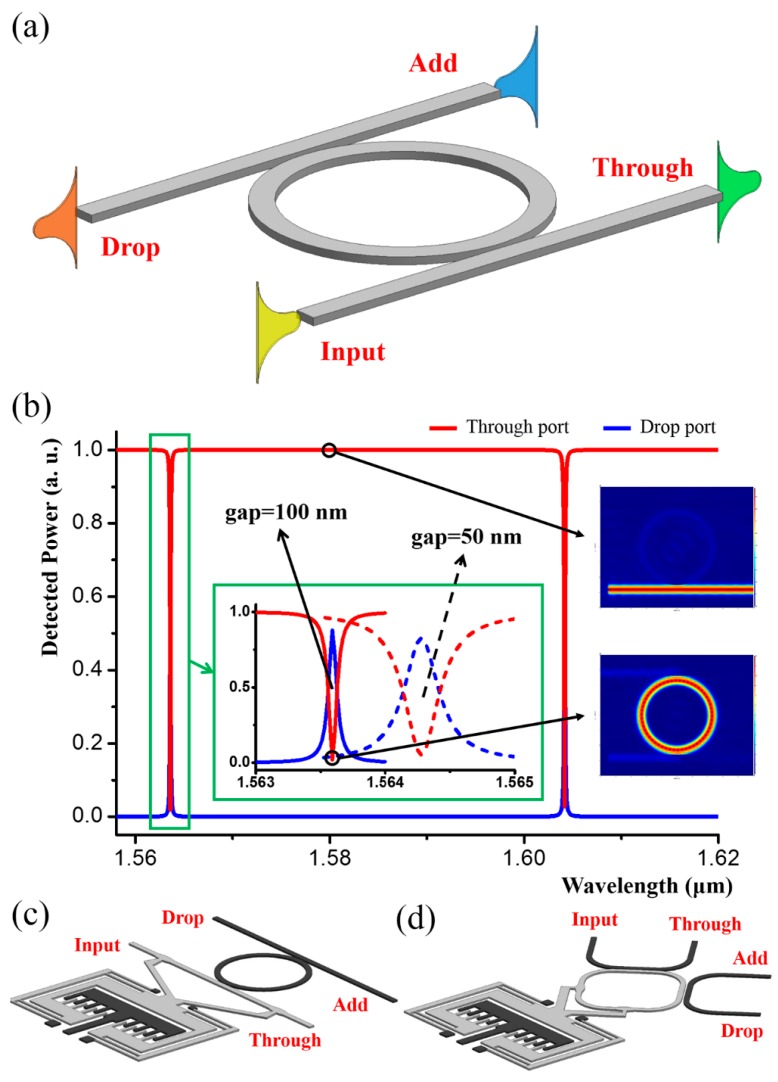
Figure 6.
(a) Schematic of an add-drop filter based on a ring resonator. (b) FDTD simulation results of the filter. The red and blue curves denote the normalized power detected by the monitors at the through and drop ports respectively. Mode profiles of the through and drop state are given as the inserts on the right-hand side. (c,d) Schematics of the tuning mechanisms by mechanically moving (c) the channel waveguide and (d) the ring.

