
Figure 3.
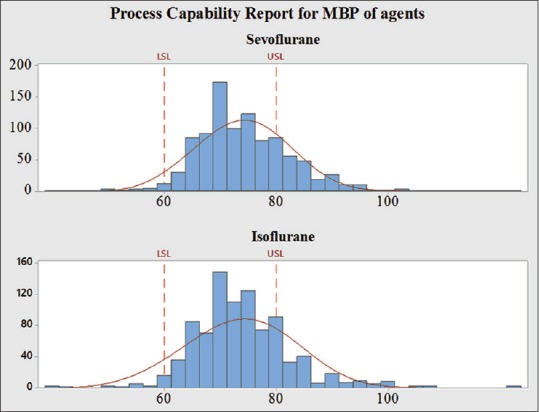
Process capability report for MBP. Process capability report for MBPs of both groups, for overall processes for SLs (LSL and USL). The assembly fit PCI data values are shown for original (nontransformed) data. Data were transformed prior to derivation of PCIs. X-axis represents the mean blood pressure readings. LSL (60 mmHg) and USL (80 mmHg) were considered for PCI evaluation. MBP – Mean blood pressure; LSL – Lower specification limit; PCI – Process capability index; USL – Upper specification limit