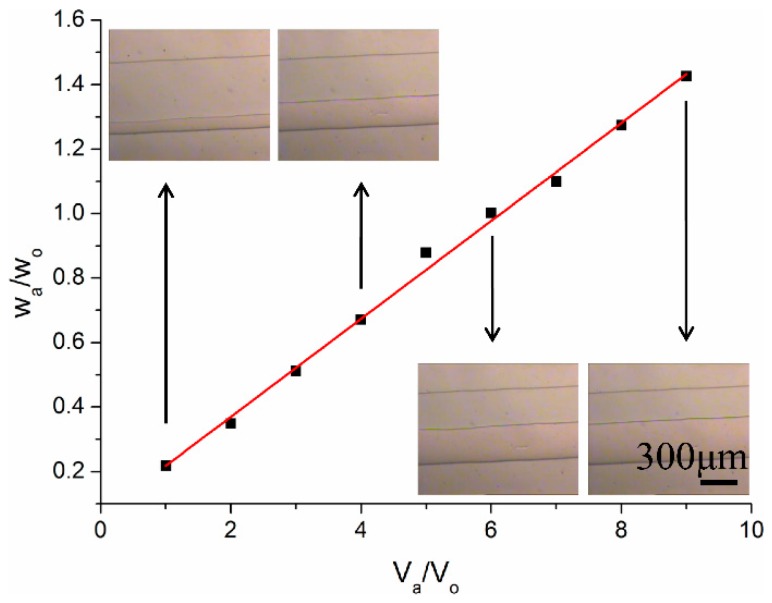
Figure 3.
The standard curve of the relationship between the flow width ratio and the velocity ratio (inset: the microphotograph of stable laminar flow corresponding to individual velocity ratio, the top phase was the aqueous phase of pure water and the bottom phase was the organic phase of n-octyl alcohol).

