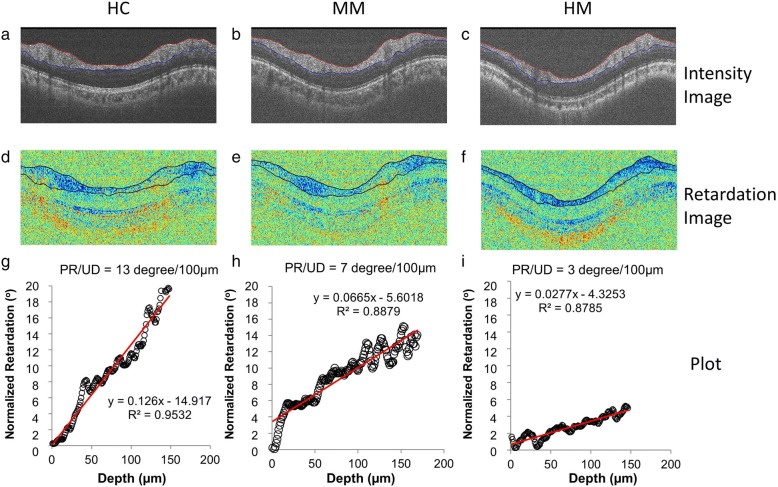
Fig. 2.
The circumpapillary RNFL imaged using PS-OCT. The OCT intensity images were obtained from a HC subject (a), a MM eye (b) and a HM eye (c). The outlined RNFL boundaries obtained from the OCT intensity images were projected onto the corresponding retardation images (d-f). Phase retardations of 512 A-scans in the inferior quadrant were plotted as a function of the scan depth in the RNFL (g and i) after the signal was normalized. The slopes of the linear regression were defined as the PR/UD (degree/100 μm) of the RNFL, and the results are listed in each panel. HC: healthy control; MM: moderate myopia; and HM: high myopia

