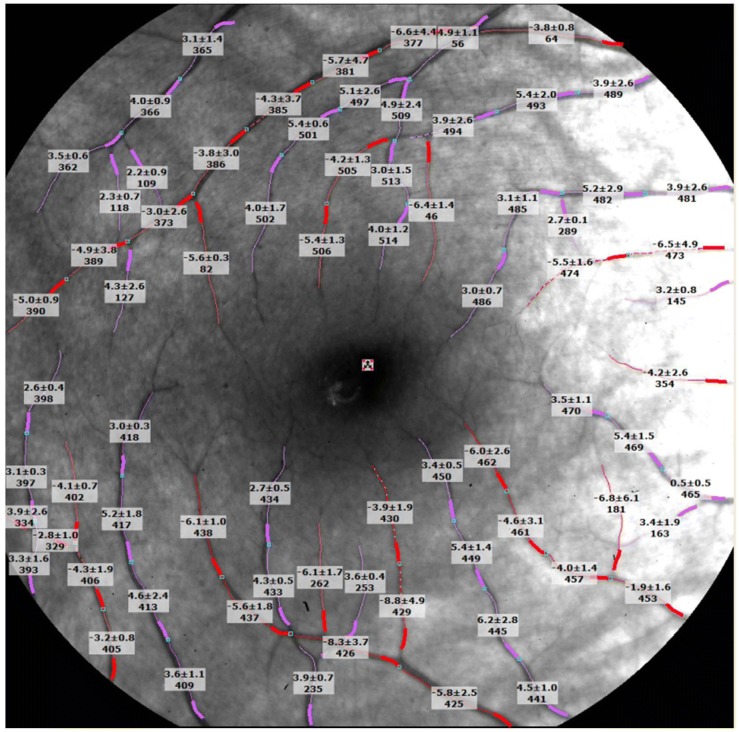
Fig. 4.
Retinal blood flow velocity measured using the RFI. The retina of a healthy subject imaged using the RFI with a field of view of 20 degrees centered on the fovea (dark area in the center) is shown. The arterioles are marked in red and overlaid with the measured blood flow velocities (expressed as the mean ± standard deviation, vessel identification, unit: mm/s); the venules and their respective velocities are marked in pink. The measured vessels cover the second, third, and fourth branches of the retinal vessels. The negative values represent arteriolar flow towards the fovea, and the positive values represent venular flow away from the fovea

