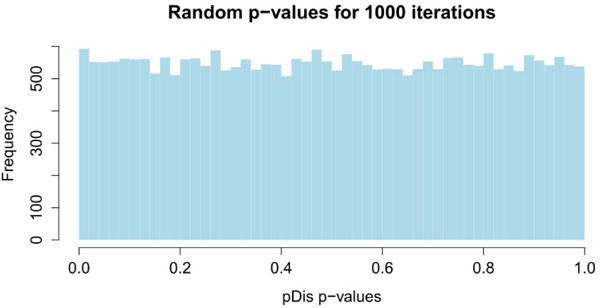
Fig. 4.

The null distribution of the p-values obtained from pDis analysis for all KEGG signaling pathway (139 pathways) in 1,000 iterations. The input gene expression values were chosen from a random normal distribution with mean of 0 and standard deviation of 1. The histogram shows the null distribution of the pooled p-values. Uniform distributions were also obtained for each individual target pathway (data not shown). The uniform distributions prove that pDis analysis does not produce any more false positives than expected.
