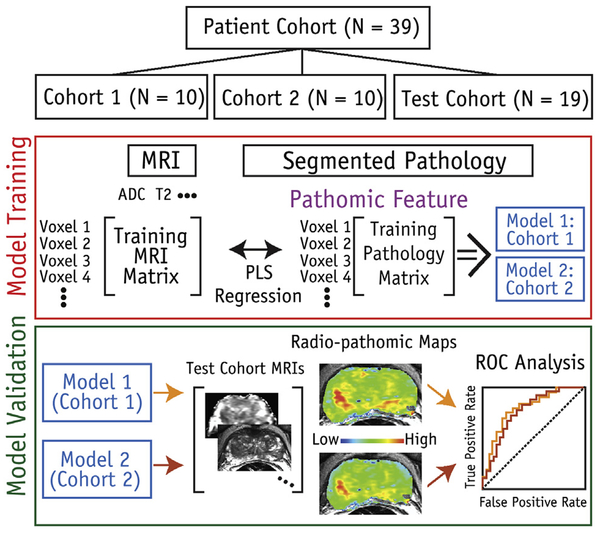
Fig. 3.
Diagram of machine-learning protocol used in study. Patients were stratified into 1 of 3 cohorts (2 independent training cohorts and 1 test cohort). Magnetic resonance imaging (MRI) values were used as input features to predict epithelium and lumen density. Two independent models were produced using the 2 training sets. Both derived models were then applied to the same test cohort. Abbreviations: ADC = apparent diffusion coefficient; PLS = partial least squares; ROC = receiver operating characteristic.

