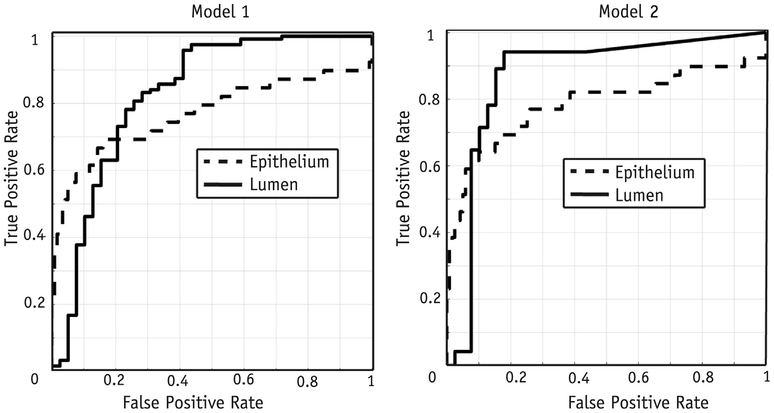
Fig. 6.
Receiver operating characteristic analysis of the performance of models 1 and 2 differentiating high-grade cancer in the test cohort. The model 1 area-under-the-curve values for the lumen and epithelium were 0.82 ± 0.09 and 0.76 ± 0.11, respectively. The model 2 performance evaluated in the test cohort showed area-under-the-curve values for the lumen and epithelium of 0.86 ± 0.08 and 0.78 ± 0.10, respectively.

