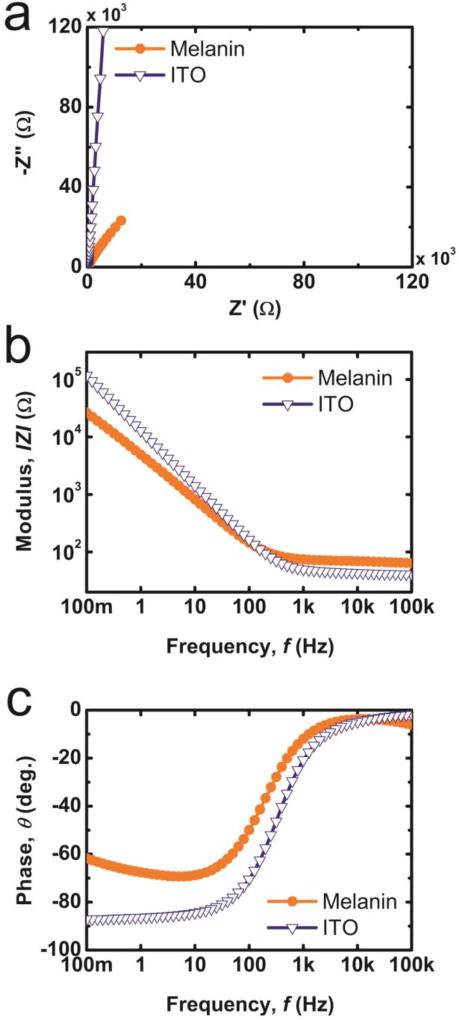
Figure 3.
Nyquist plots and bode plots from EIS measurements on a 40nm thick polydopamine melanin films coated on indium tin oxide (Melanin) and bare indium tin oxide (ITO) in the frequency range of 10−1–105Hz at open circuit potential ([Area = 1cm2). Representative graphs are shown including (a) a Nyquist plot, (b) |Z| versus f (c) and phase versus f.

