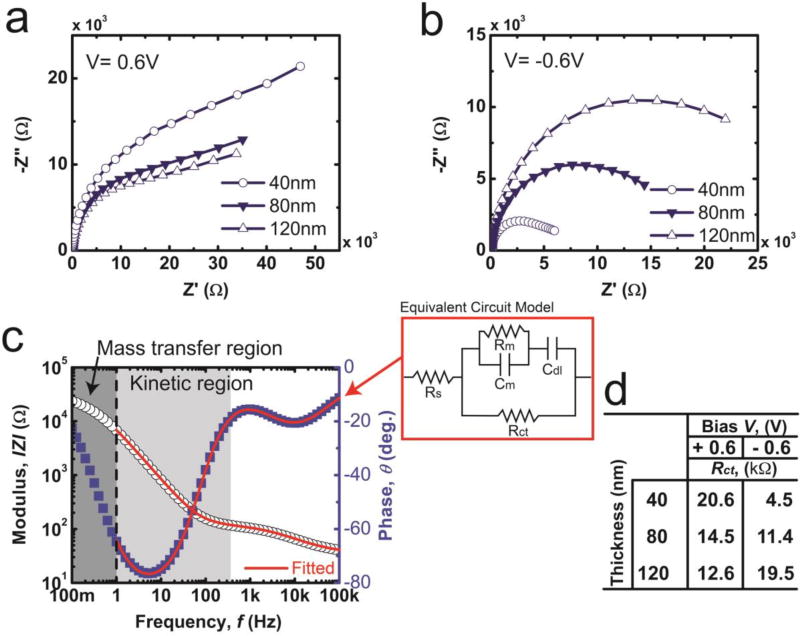
Figure 5.
Nyquist plots from EIS measurements on polydopamine melanin films of varying thicknesses coated on indium tin oxide substrates in 0.01M PBS in the frequency range of 10−1–105Hz ([Area = 1cm2). at (a) Edc = 0.6V versus Ag/AgCl (b) Edc = −0.6V versus Ag/AgCl (c) A representative results of the fit between experimental data and the model is shown for an ITO substrate with a PDM film 120nm in thickness at a dc bias of Edc = −0.6V versus Ag/AgCl. The data is fit using a modified Randles circuit model with the following parameters: solution resistance (Rs); film capacitance contribution of the constant phase element (Cm, CPE); out of plane resistance of the film (Rm); double layer capacitance contribution of the constant phase element (Cdl, CPE); charge transfer resistance (Rct). (d) The circuit diagram of the modified Randle’s circuit model and a tabulation of extracted values of Rct from this model.

