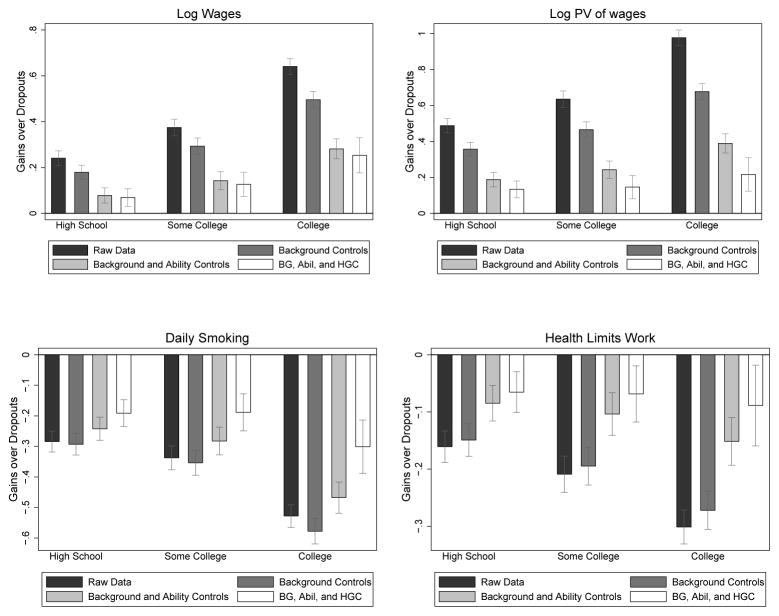
Figure 2.
Observed and Adjusted Benefits from Education
Notes: The bars represent the coefficients from a regression of the designated outcome on dummy variables for educational attainment, where the omitted category is high school dropout. Regressions are run adding successive controls for background and proxies for ability. Background controls include race, age in 1979, region of residence in 1979, urban status in 1979, broken home status, number of siblings, mother’s education, father’s education, and family income in 1979. Proxies for ability are average score on the Armed Services Vocational Aptitude Battery (ASVAB) tests and ninth grade GPA in core subjects (language, math, science, and social science). See the discussion surrounding Table 1 (below) and Web Appendix A.2 for additional details. “Some College” includes anyone who enrolled in college, but did not receive a four-year college degree. The white bars additionally control for highest grade completed (HGC). Source: NLSY79 data.

