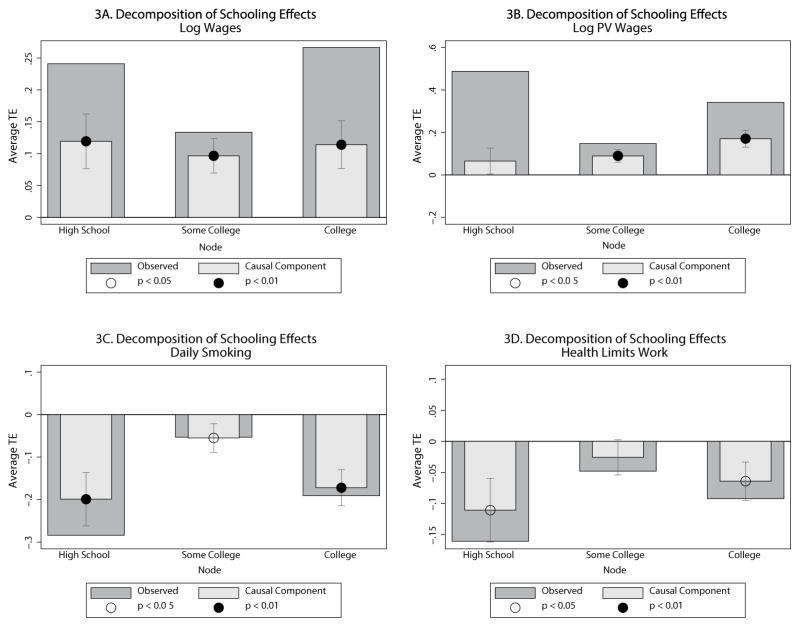
Figure 3.
Causal Versus Observed Differences by Final Schooling Level (compared to next lowest level)
Notes: These figures report pairwise treatment effect (18) for the indicated schooling nodes. Each bar compares the mean outcomes from a particular schooling level j and the next lowest level j−1 defined for the set of persons who complete schooling at j−1 or j. The “Observed” bar displays the observed differences in the data. The “Causal Component” bar displays the estimated average treatment effect to those who get treated (ATE) for the indicated group. The difference between the observed and causal treatment effect is attributed to the effect of selection and ability. Selection includes sorting on gains. The error bars and significance levels for the estimated ATE are calculated using 200 bootstrap samples. Error bars show one standard deviation and correspond to the 15.87th and 84.13th percentiles of the bootstrapped estimates, allowing for asymmetry. Significance at the 5% and 1% levels is shown by open and filled circles on the plots, respectively.

