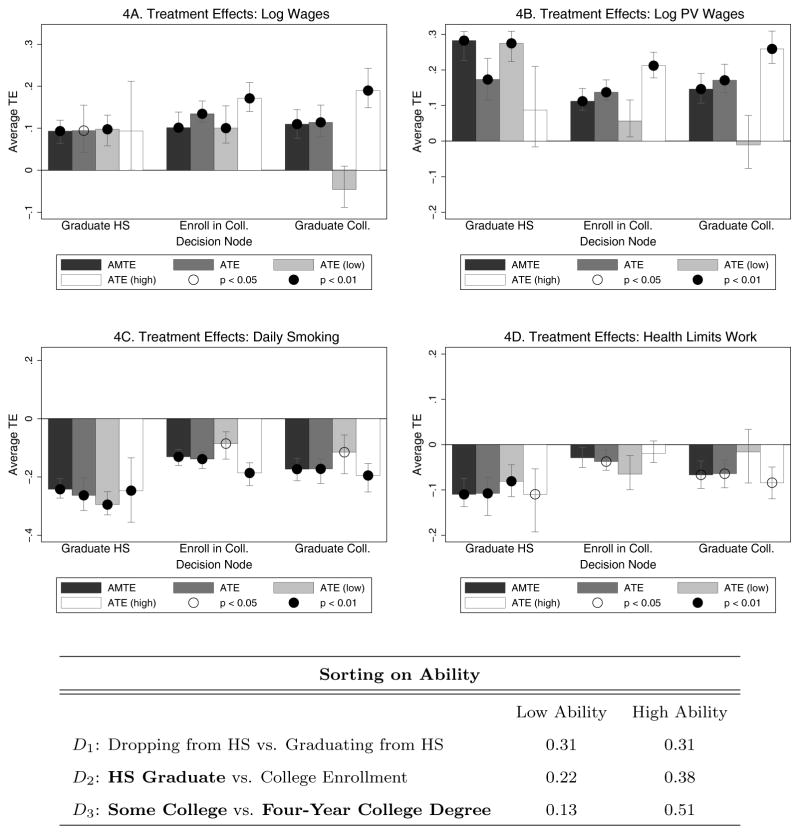
Figure 4.
Treatment Effects of Outcomes by Decision Node
E(Yk|Fix Dj = 0, Qj = 1) − E(Yk|Fix Dj = 1, Qj = 1)
Notes: The nodes in the table correspond to the next stage of the transition analyzed. Thus, “Graduate HS” refers to the decision node of whether or not the agent will graduate high school, and refers to the base state of not graduating high school. The error bars and significance levels for the estimated ATE Equation (13) are calculated using 200 bootstrap samples. Error bars show one standard deviation and correspond to the 15.87th and 84.13th percentiles of the bootstrapped estimates, allowing for asymmetry. Significance at the 5% and 1% level are shown by hollow and black circles on the plots, respectively. The figure reports various treatment effects for those who reach the decision node, including the estimated ATE conditional on endowment levels. The high- (low-) ability group is defined as those individuals with cognitive and socio-emotional endowments above (below) the median in the overall population. These categories are not mutually exclusive, as some people may be high-ability in one dimension but low-ability in another. The table below the figure shows the proportion of individuals at each decision (Qj = 1) that are high- and low-ability. The larger proportion of the individuals are high-ability and a smaller proportion are low-ability in later educational decisions. In this table, final schooling levels are highlighted using bold letters.

