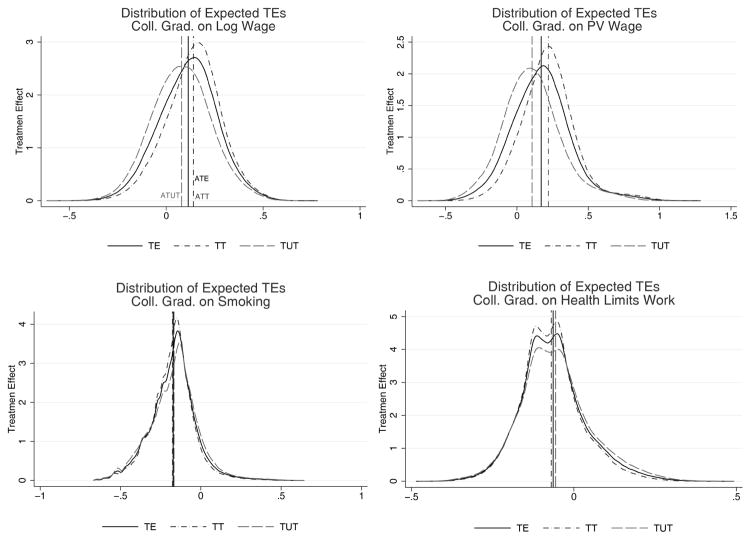
Figure 7.
Distributions of Expected Treatment Effects: College Graduation
Notes: Distributions of treatment effects including continuation values for those who reach the educational choice. The vertical lines represent the average treatment effects (ATE, ATT, and ATUT) for each of the distributions.

