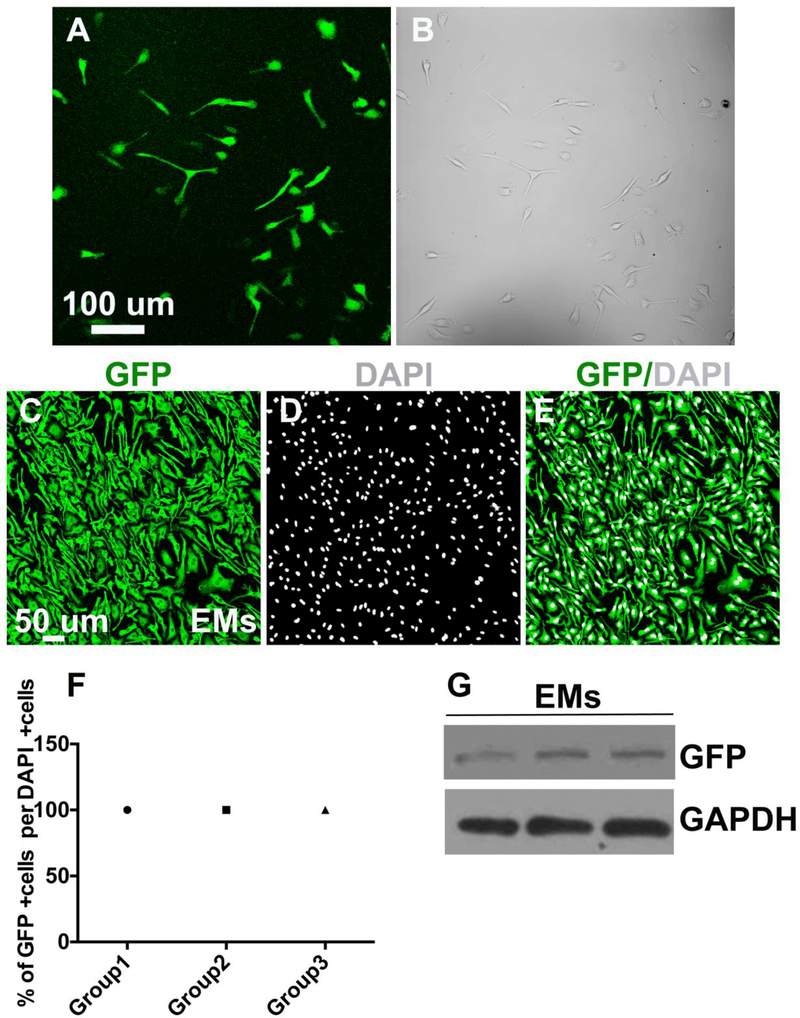
Figure 2.
Isolation of a pure EGFP-expressing EM population from Csf1r-EGFP+/tg transgenic embryos A. Confocal image of sorted fluorescent EMs in culture showing their macrophage-like morphology and monolayer growth B. Phase contrast image of cultured EMs confirming that monolayers contain only fluorescent cells. C-G. Fluorescent isolated cells are EGFP-expressing EMs: C. Fluorescence ICC confocal image of EMs stained with GFP antibody (green) D. EMs stained with nuclear counterstain DAPI (gray) E. Merged image of GFP antibody labeling and DAPI F. Quantification of the GFP and DAPI signals demonstrating that 100% of DAPI positive EMs were GFP positive. G. Immunoblot image of GFP showing that EMs express GFP at the protein level. N = 3 groups. Scale bars 50 μm

