Figure 3.
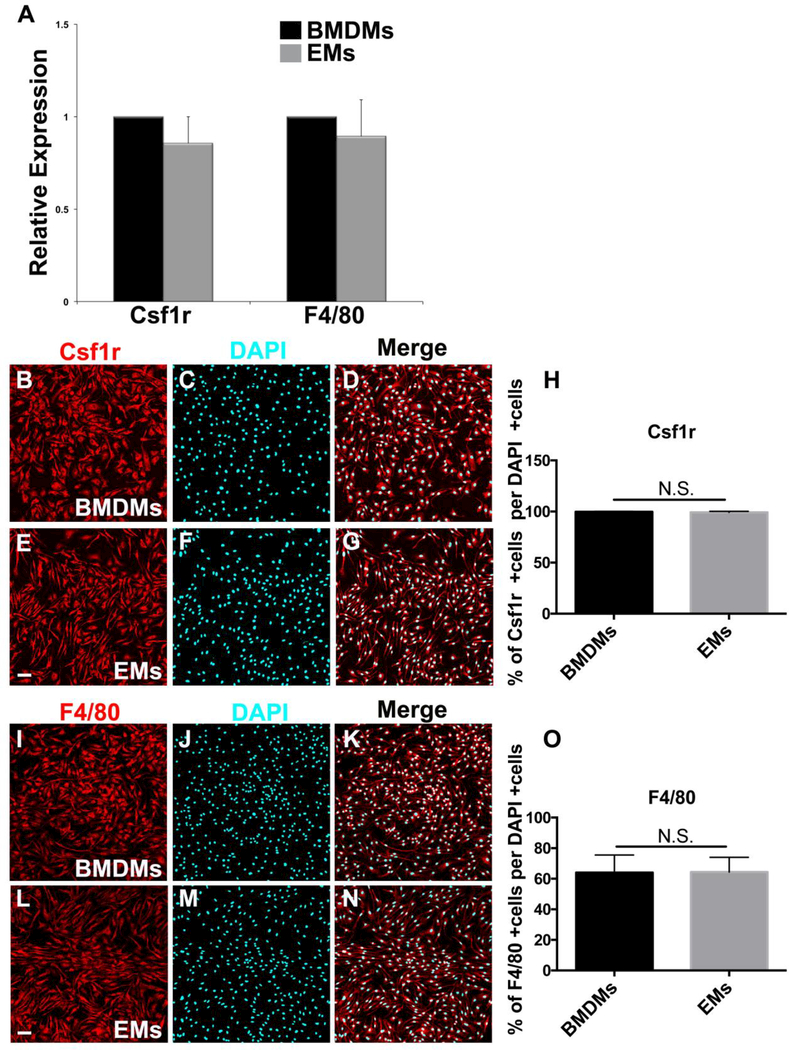
Macrophage identity of E9.5 Csf1r-EGFP+/tg FACS cells. A. Csf1r and F4/80 mRNA expression showed no significant differences between EMs and BMDMs. B-D. Fluorescence ICC images of BMDMs stained with Csf1r (red) and DAPI (blue). E-G. Fluorescence ICC images of EMs stained with Csf1r (red) and DAPI (blue). H. Quantification of the Csf1r signal demonstrating that ~100% of DAPI positive BMDMs and EMs were CSf1r positive. I-K. Fluorescence ICC images of BMDMs stained with F4/80 (red) and DAPI (blue). L-N. Fluorescence ICC images of EMs stained with F4/80 (red) and DAPI (blue). O. Quantification of the F4/80 signal demonstrating ~70% of DAPI positive BMDMs and EMs were F4/80 positive. Error bars indicate SE of the mean. N = 3. Scale bars 50 μm.

