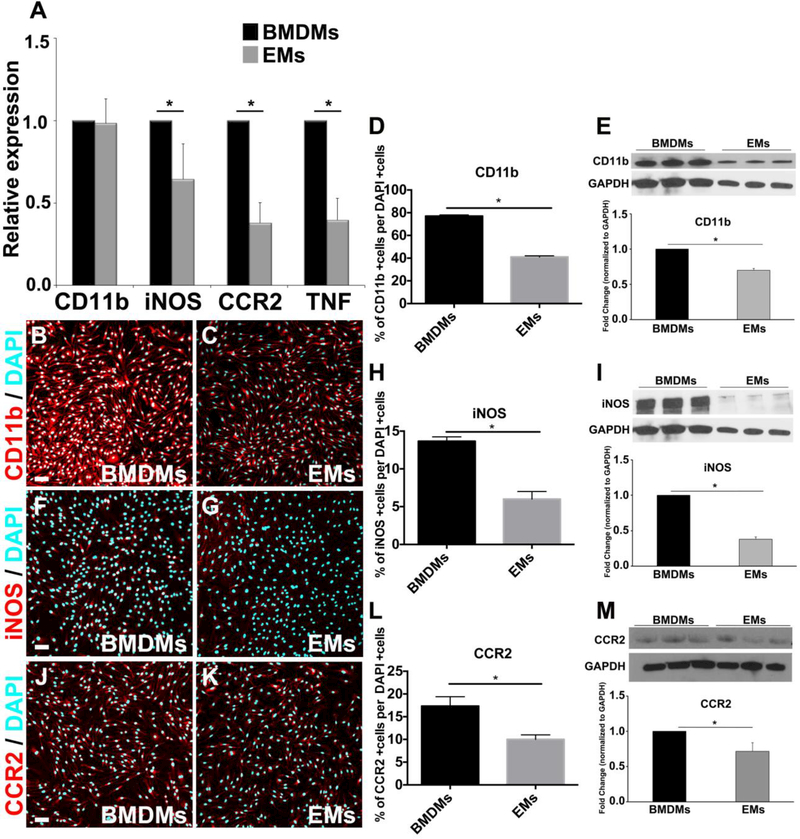
Figure 4.
Expression of pro-inflammatory macrophage markers by EMs A. Comparative transcript expression analysis of pro-inflammatory macrophage markers, CD11b, iNOS, CCR2, and TNF in EMs and BMDMs. EMs significantly expressed less iNOS, CCR2, and TNF than BMDMs, while CD11b expression was similar between EMs and BMDMs. B. and C. Merged fluorescence ICC images of BMDMs (B) and EMs (C) stained with CD11b (red) and DAPI (blue). D. Quantification analysis of the CD11b ICC images using Farsight toolkit demonstrating that significantly fewer EMs express CD11b compared to BMDMs. E. Immunoblot and semi-quantitative analysis of CD11b showed that EMs significantly expressed less CD11b compared to BMDMs. F. and G. Merged fluorescence ICC images of BMDMs (F) and EMs (G) stained with iNOS (red) and DAPI (blue). H. Quantification analysis of the iNOS ICC images using Farsight toolkit showed that significantly fewer EMs express iNOS compared to BMDMs. I. Immunoblot and semi-quantitative analysis of iNOS showed that EMs significantly expressed less iNOS compared to BMDMs. J. and K. Merged fluorescence ICC images of BMDMs (J) and EMs (K) stained with CCR2 (red) and DAPI (blue). L. Quantification analysis of the CCR2 ICC images using Farsight toolkit showed that significantly fewer EMs express CCR2 compared to BMDMs. M. Immunoblot and semi-quantitative analysis of CCR2 showed that EMs significantly expressed less CCR2 compared to BMDMs. Error bars indicate SE of the mean. N = 3. Scale bars 50 μm.

