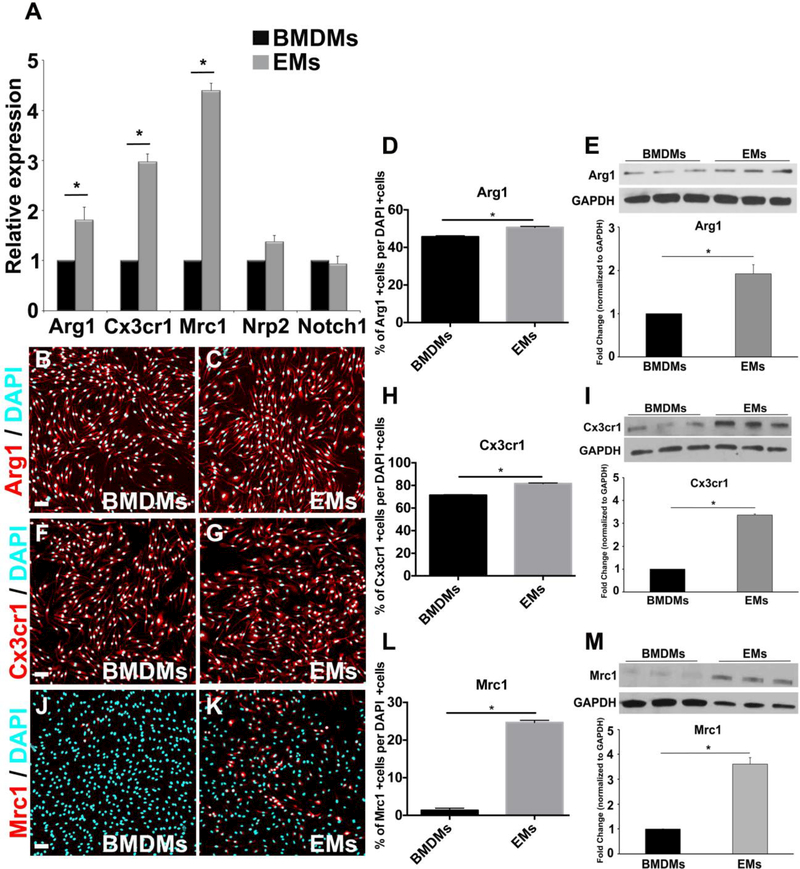
Figure 5.
Expression of pro-angiogenic macrophage markers by EMs A. Comparative transcript expression analysis of pro-angiogenic macrophage markers, Arg1, Cx3cr1, Mrc1, Nrp2 and Notch1 in EMs and BMDMs. EMs significantly expressed more Arg1, Cx3cr1 and Mrc1, while both EMs and BMDMs equivalently expressed Nrp2 and Notch1. B., and C. Merged fluorescence ICC images of BMDMs (B) and EMs (C) stained with Arg1 (red) and DAPI (blue). D. Quantification analysis of the Arg1 ICC images using Farsight toolkit showed that significantly more EMs express Arg1 compared to BMDMs. E. Immunoblot and semi-quantitative analysis of Arg1 showed that EMs significantly expressed more Arg1 compared to BMDMs. F. and G. Merged fluorescence ICC images of BMDMs (F) and EMs (G) stained with Cx3cr1 (red) and DAPI (blue). H. Quantification analysis of the Cx3cr1 ICC images using Farsight toolkit showed that significantly more EMs express Cx3cr1 compared to BMDMs. I. Immunoblot and semi-quantitative analysis of Cx3cr1 showed that EMs significantly expressed more Cx3cr1 compared to BMDMs. J. and K. Merged fluorescence ICC images of BMDMs (J) and EMs (K) stained with Mrc1 (red) and DAPI (blue). L. Quantification analysis of the Mrc1 ICC images using Farsight toolkit showed that significantly more EMs express Mrc1 compared to BMDMs. M. Immunoblot and semiquantitative analysis of Mrc1 showed that EMs significantly expressed more Mrc1 compared to BMDMs. Error bars indicate SE of the mean. N = 3. Scale bars 50 μm.

