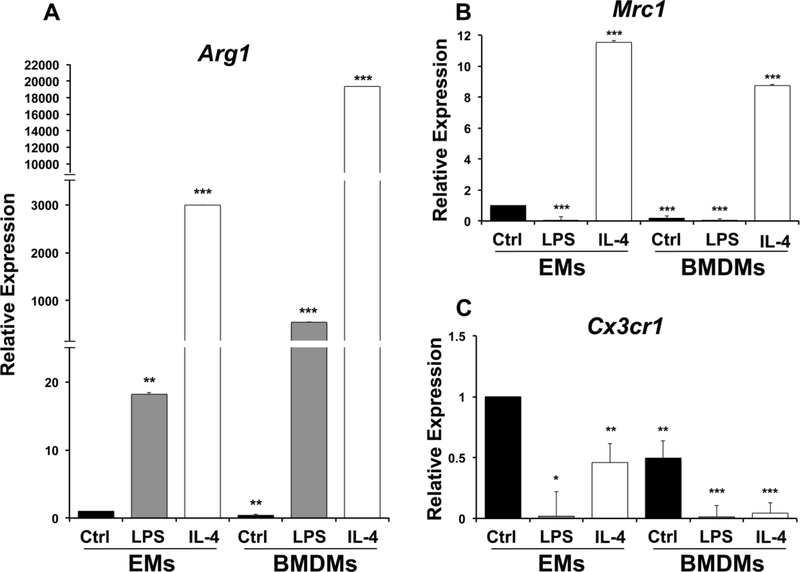
Figure 7.
Expression profiles of pro-angiogenic macrophage markers LPS-treated or M1 driven macrophages and IL-4 treated or M2 driven macrophages A. EMs significantly express more of Arg1 as compared to untreated BMDMs. IL-4 and LPS treated EMs/BMDMs significantly express more Arg1 as compared to untreated EMs. B. Mrc1 expression was significantly attenuated in LPS treated EMs, BMDMs and LPS treated BMDMs and up-regulated in IL-4 treated EMs /BMDMs as compared to untreated EMs. C. Cx3cr1 expression was significantly attenuated in BMDMs, IL-4 and LPS treated EMs/BMDMs as compared to untreated EMs. Error bars indicate SE of the mean. N=3.

