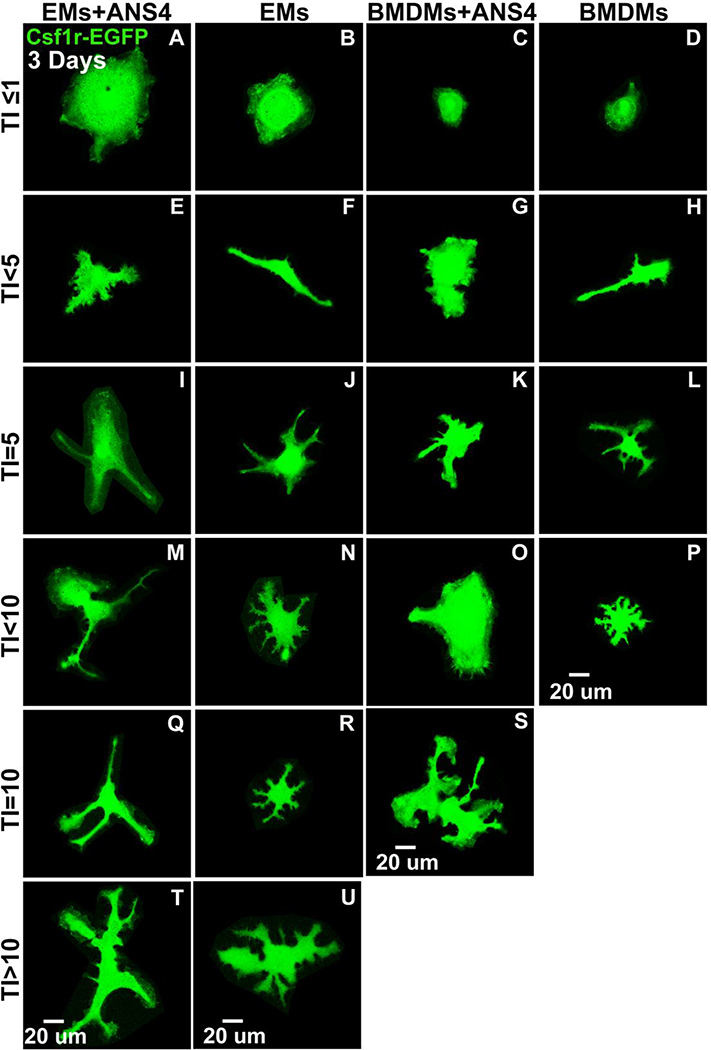
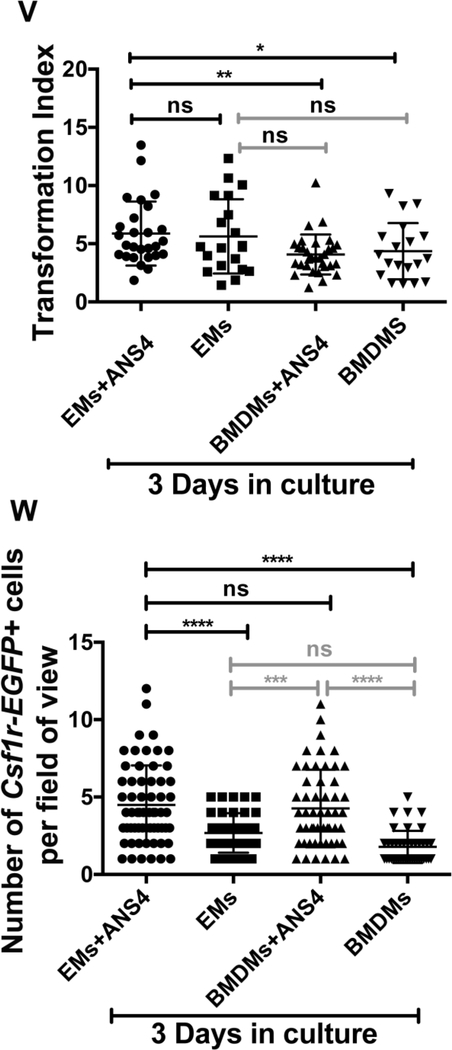
Figure 9.
After 3 days, EMs differentiated into amoeboid/ramified microglia morphologies in the presence of NSPCs. Csf1r-EGFP transgene was used to visualize the morphological changes of EMs and/or BMDMs into microglial phenotypes. (A, B, C, D, E, F, G and H) Confocal images of EMs + ANS4, EMs, BMDMs + ANS4 and BMDMs with TI ≤ 5 displayed rounded and elongated morphologies. (I, J, K, L, M, N, O and P) Confocal images of EMs + ANS4, EMs, BMDMs + ANS4 and BMDMs with TI < 10 displayed more amoeboid forms. (Q, R, S, T and U) Confocal images of EMs + ANS4, EMs and BMDMs + ANS4 with TI ≥ 10, displayed more ramified cell forms, but not BMDMs cultured alone. (V) Quantitative analysis of the morphological changes of EMs or BMDMs into microglia as shown in the distribution of the TI values as function of the culture conditions, the TI values of EMs + ANS4 significantly increased compared to the TI values of BMDMs + ANS4 and BMDMs cultured alone, but no statistically significant differences were observed between EMs + ANS4 and EMs cultured alone. (W) Density measurements in EMs + ANS4, EMs, BMDMs + ANS4 and BMDMs cultures. The data show significantly a higher density of EMs identified in groups that contained NSPCs compared to the other groups.


