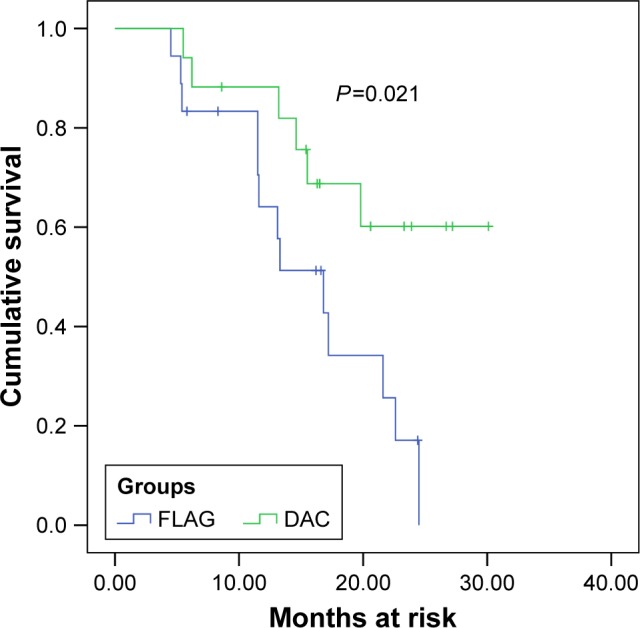
Figure 1.

Kaplan–Meier plot of OS for FLAG and DAC regimen groups.
Notes: The blue line represents the FLAG group; the green line represents the DAC group.
Abbreviations: DAC, low-dose decitabine with aclacinomycin and cytarabine; FLAG, fludarabine in combination with cytarabine and G-CSF; OS, overall survival.
