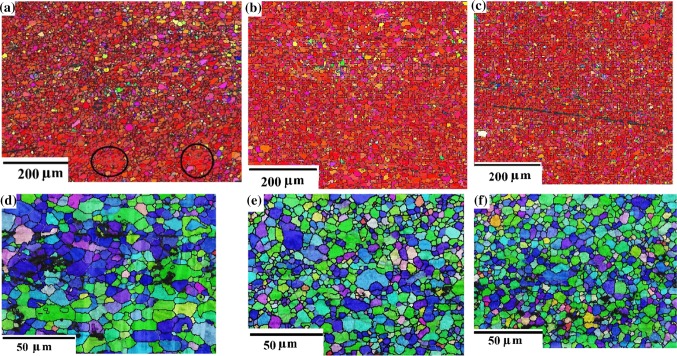
Figure 5.
EBSD images over the cross sections of an HPT-processed Mg sample after one turn. a–c Images from the top to the bottom, the view direction toward the upper surface. d–f High magnification images, the view direction toward the normal of the cross-sectional surface. a, d Center, b, e halfway, c, f edge. High-angle grain boundaries are black and low-angle boundaries gray in color. Two large recovered grains are encircled in a

