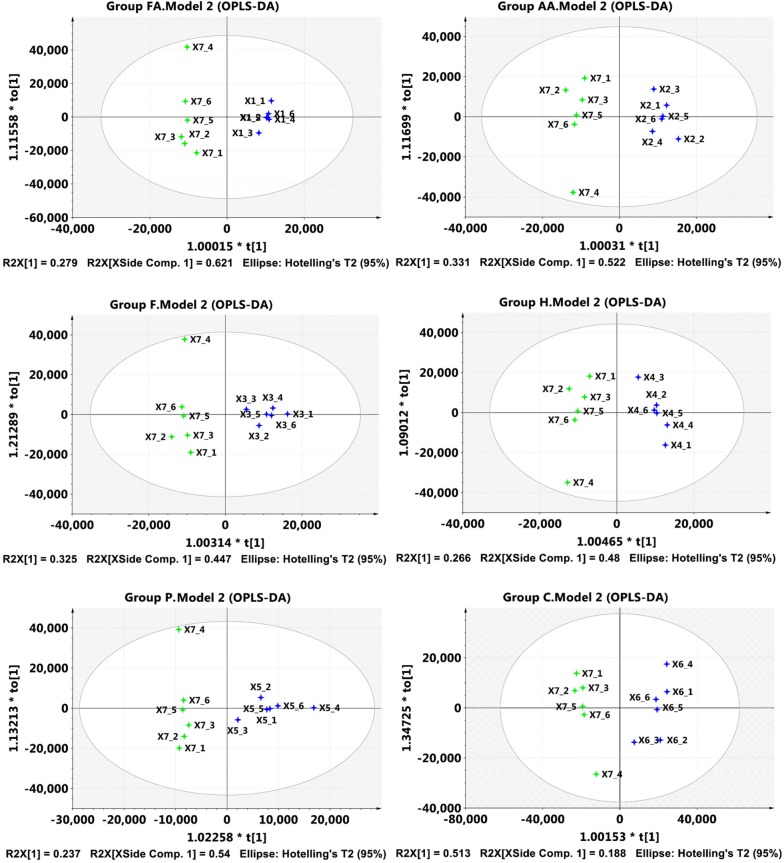
Fig. 2.
OPLS-DA analysis of the total metabolites identified in the inhibitor-treated groups and control. Group FA, cells treated by formic acid. Group AA, cells treated by acetic acid. Group F, cells treated by furfural. Group H, cells treated by 5-HMF. Group P, cells treated by phenol. Group C, cells treated by combined inhibitors. X1_1 to X1_6 were six duplications of metabolites obtained in formic acid-treated group, X2_1 to X2_6 were those in acetic acid treated group, X3_1 to X3_6 were those in furfural treated group, X4_1 to X4_6 were those in 5-HMF treated group, X5_1 to X5_6 were those in phenol-treated group, X6_1 to X6_6 were those in combined inhibitors treated group, and X7_1 to X7_6 were those in control group. The horizontal direction (t [1]) indicates the separation of the two independent groups; the farther the distance on the horizontal axis, the greater the discrepancies of the differentially expressed metabolites of the two groups. The vertical direction (to [1]) indicates the separation within the reduplicates of a certain group, which is less important than the horizontal direction

