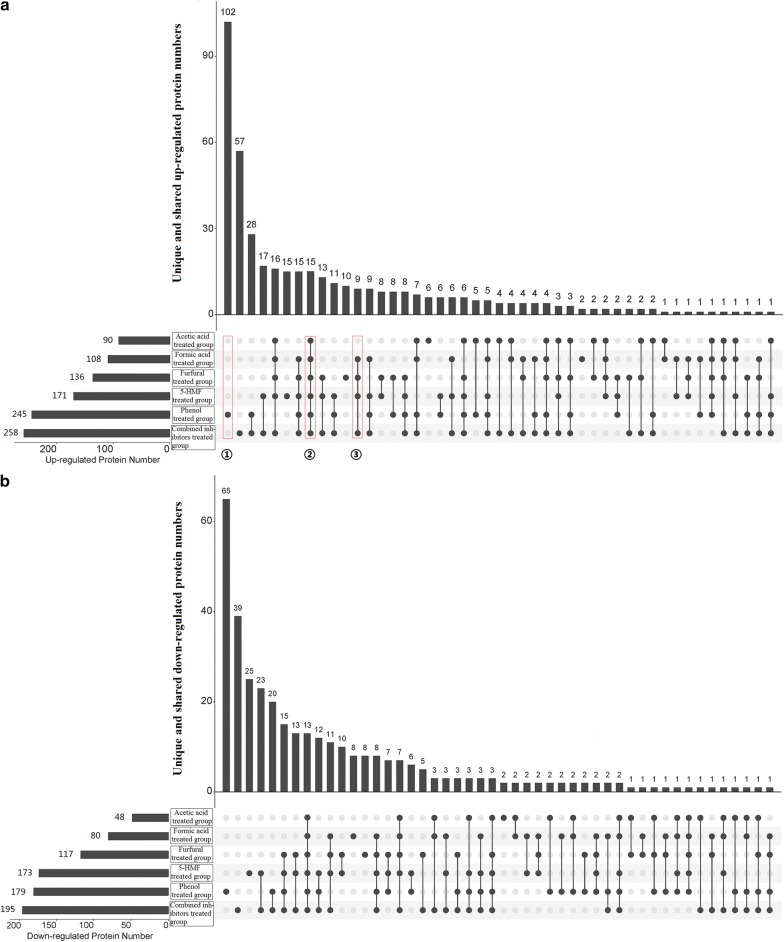
Fig. 3.
Numbers of the unique and shared differentially expressed proteins of the six inhibitor-treated groups. a The numbers of unique and shared up-regulated proteins in the presence of different inhibitors, and b the numbers of unique and shared down-regulated proteins in the presence of different inhibitors. These protein numbers are shown in an UpSet diagram, which allows for a clearer plotting of large data sets compared to the Venn diagram. Dark circles connected with a line indicate that the proteins are only differentially expressed in the corresponding groups labeled with dark circles, but not in the other groups labeled with gray circles. For example, ① denotes the proteins are only differentially expressed in phenol-treated group, while not differentially expressed in the other groups, that is, these proteins are unique in phenol-treated group; ② denotes the proteins are differentially expressed in all the groups, that is, these proteins are shared by all the groups; ③ denotes the proteins are only differentially expressed in formic acid, furfural, 5-HMF, and combined inhibitors treated groups, while not differentially expressed in acetic acid and phenol-treated groups. Combined inhibitors means a combination of formic acid, acetic acid, furfural, 5-HMF, and phenol

