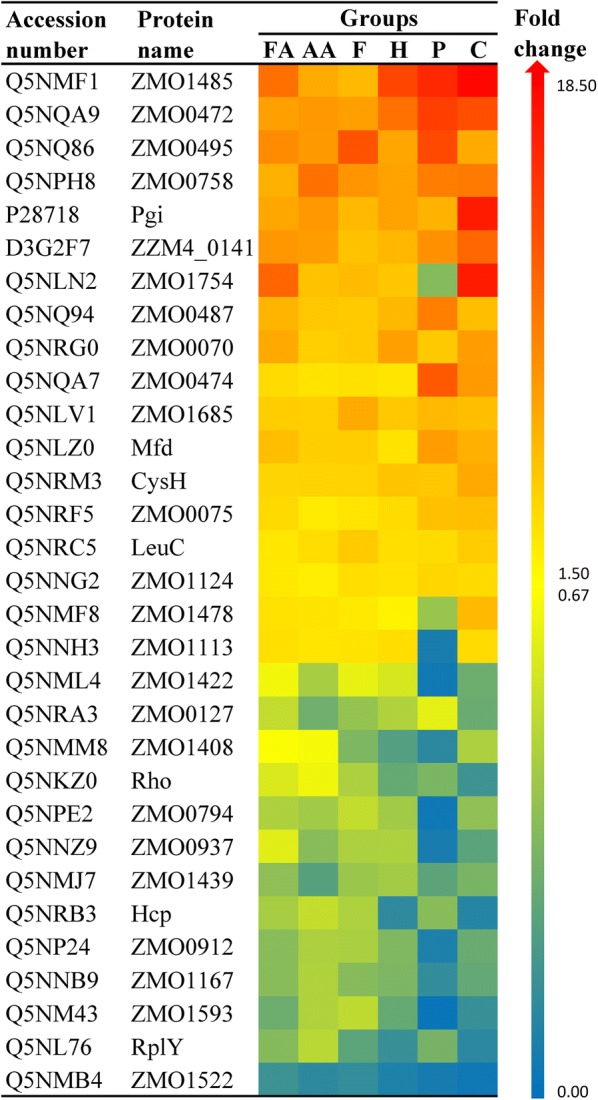
Fig. 4.

Heat map of the differentially expressed proteins shared by the six inhibitor-treated groups. Rows are colored by the fold changes of the proteins in inhibitor-treated groups relative to the corresponding proteins in control. FA cells treated by formic acid, AA cells treated by acetic acid, F cells treated by furfural, H cells treated by 5-HMF, P cells treated by phenol, C cells treated by combined inhibitors. The darker the red color, the greater the up-regulation fold change. The darker the blue color, the greater the down-regulation fold change
