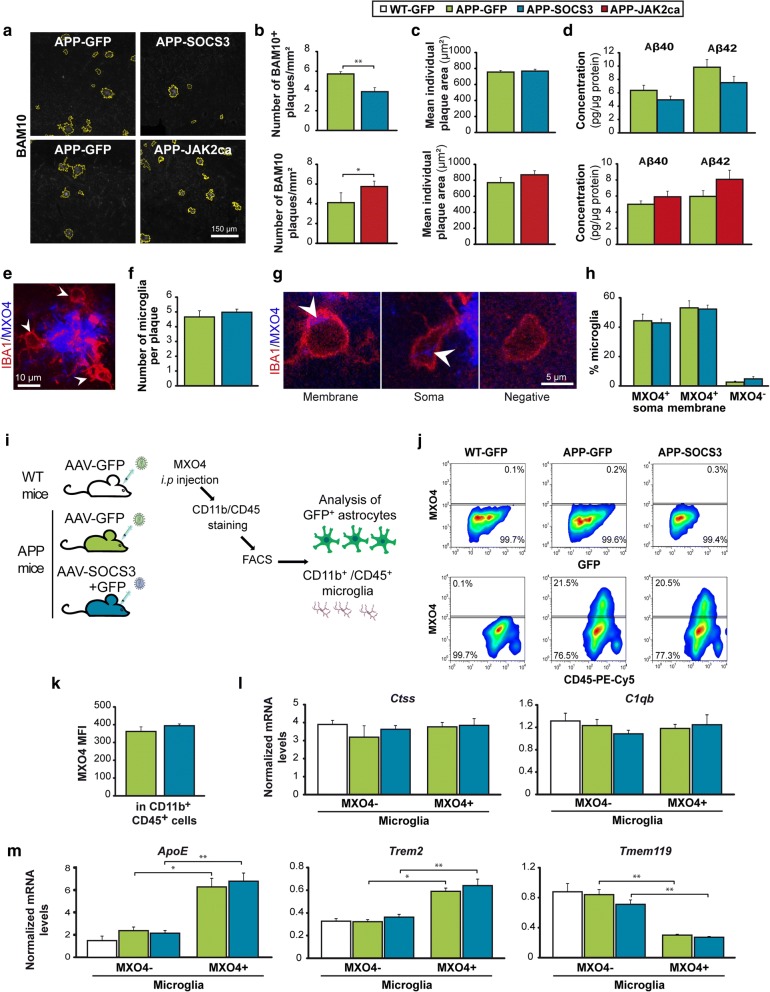
Fig. 4.
Inhibition of JAK2-STAT3-mediated astrocyte reactivity reduces amyloid load in APP mice without impacting microglial cells a, Representative images of BAM10+ amyloid plaques (white) automatically delineated in yellow in APP-GFP, APP-SOCS3 and APP-JAK2ca mice. b, The number of hippocampal BAM10+ plaques is significantly decreased by SOCS3 (N = 9–8) and increased by JAK2ca in APP mice (N = 6–6). SOCS3 and JAK2ca effects were measured in two independent cohorts. c, The average size of individual BAM10+ amyloid plaque is similar between groups. d, Dosage of Aβ40 and Aβ42 peptide concentrations in Triton-X100-soluble protein homogenates from the hippocampus of APP-GFP (N = 10 or 6), APP-SOCS3 (N = 8) and APP-JAK2ca mice (N = 6). Aβ40 and 42 levels are not significantly different between groups. e, IBA1+ microglial cells (red, arrowheads) in contact with a MXO4+ amyloid plaque (blue). f, The number of microglia per plaque is similar between APP-GFP and APP-SOCS3 mice. N = 10–8. g, Confocal images of MXO4+ material (blue) in IBA1+ microglial cells (red). Microglial cells in contact with plaques either display MXO4 staining (white arrowhead) at the membrane, in the cytosol or are MXO4−. h, The proportion of these three classes of microglial cells is not different between groups. N = 10–8. i, Experimental design to monitor Aβ phagocytosis. WT-GFP (N = 10), APP-GFP (N = 6) and APP-SOCS3 (N = 8) mice were injected with MXO4, 3 h before sacrifice. After staining, hippocampal CD11b+/CD45+ microglia and GFP+ astrocytes were analyzed by FACS. j, Representative gates to analyze MXO4+ amyloid uptake in astrocytes and microglia. There are 20% MXO4+ microglial cells in both APP-GFP and APP-SOCS3 groups and no MXO4+ astrocytes. k, No difference in the MXO4 median fluorescent intensity (MFI) is observed between APP-GFP and APP-SOCS3 microglial cells. l-m, RT-qPCR analysis on microglial cells acutely isolated from the hippocampus of 12 month-old WT-GFP, APP-GFP and APP-SOCS3 mice. l mRNA levels of Ctss and C1qb, two microglial homeostatic genes, is similar in all groups. m, Apoe and Trem2 mRNA levels are higher in phagocytic MXO4+ microglia than non-phagocytic MXO4− microglia, while Tmem119 levels are lower in MXO4+ microglia. This transcriptional profile is reminiscent of DAM microglia [34]. Astrocyte de-activation by SOCS3 does not impact the transcriptional profile of either type of microglia. N = 3–8/group. b, d, h, Student t test. c, f, k, Kruskall-Wallis test. l, m, One way ANOVA to compare the 3 groups within MXO4− cells and Student t test to compare two groups within MXO4+ cells. Mann-Whitney test to compare MXO4+ and MXO4− microglial cells within APP-GFP or APP-SOCS3 groups. * p < 0.05, ** p < 0.01

