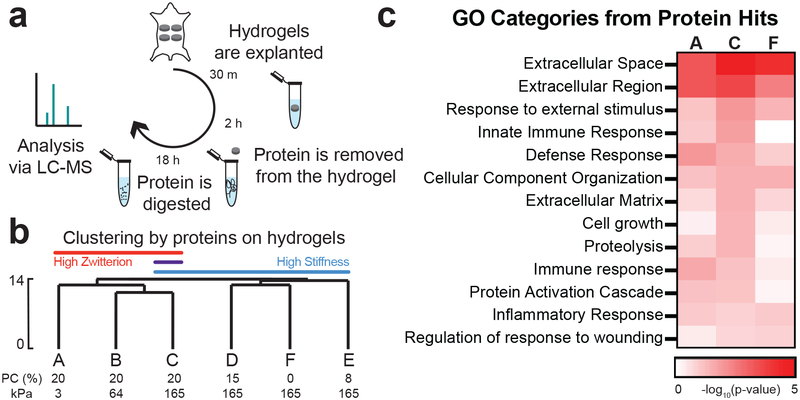
Figure 3. Identity of adsorbed proteins distinguishes highly zwitterionic from stiff hydrogels.
a) Schematic of how protein was collected from implants and analyzed via LC-MS. b) Hierarchical clustering of LC-MS data normalized by the type of protein adsorbed to each hydrogel. The percentage of PC content and the Young’s modulus for each hydrogel is labeled below. The scale depicted on the side is the Euclidean distance. c) Heat map of the log10(p-value) for select Gene Ontology (GO) categories identified from the proteins that adhered to hydrogels A, C, and F. These were identified using DAVID with all proteins identified as the background.

