
Figure 4.
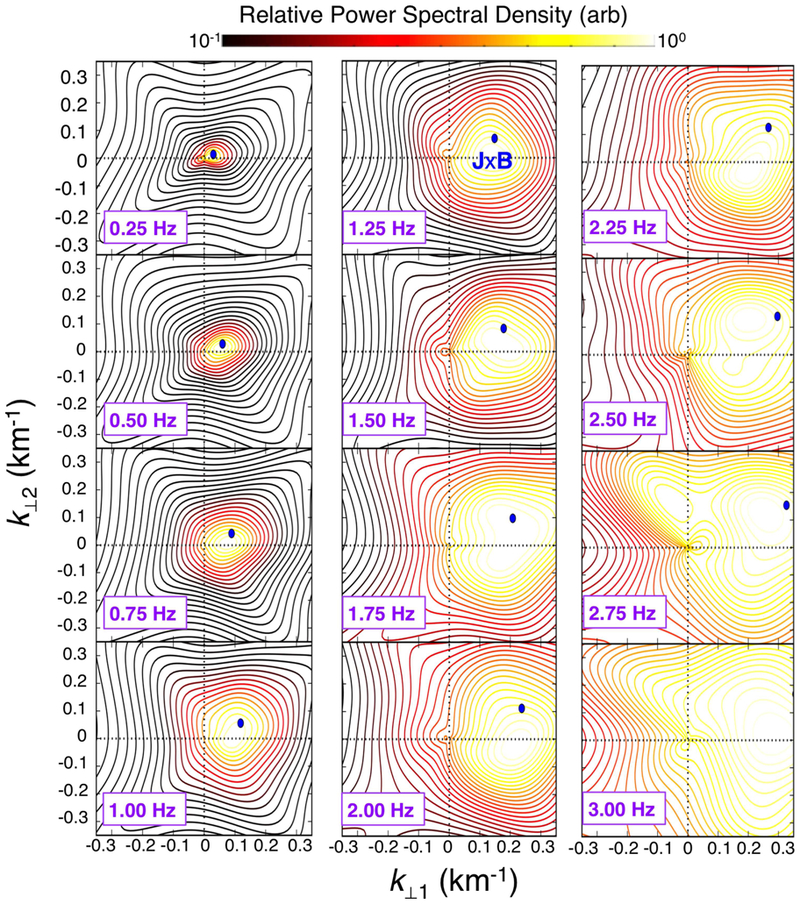
Power spectral density in the k⟘1 – k⟘2 at frequencies in the spacecraft frame between 0.25 and 3.00 Hz determined via k-filtering. The corresponding solution from the J×B method at each frequency is indicated with a solid blue dot. In each, there is good agreement between location of the peak contour and the wave vector determined via the J×B method, indicating a robust determination of k. At higher frequencies, spatial aliasing effects distorted the shape and location of the peak power spectral density.