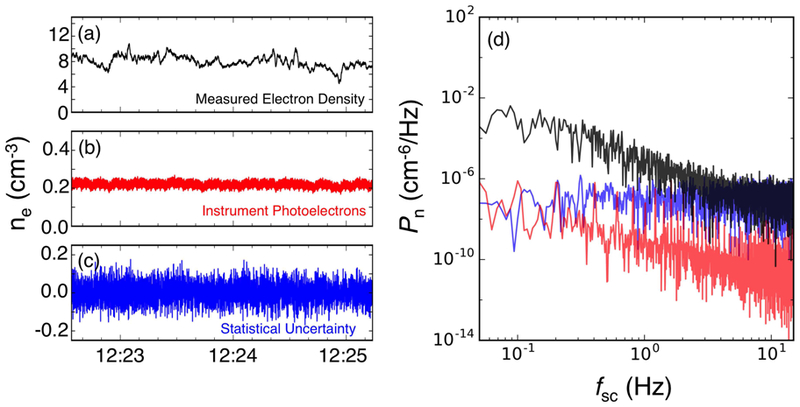
Figure 9.

(a-c) Example time series of measured electron number density, modeled DES instrument photoelectron densities, and estimated Poisson noise on 4 Oct 2016 from 12:22:34–12:25:13 UT on MMS1. (d) Power spectral density for each time series. The Poisson noise produces a flat spectrum that dominates the signal above ~ 4 Hz. Photoelectrons exhibit a more complex spectrum, with sharp peaks above ~0.2 Hz due to the superposition of instrument photoelectron signatures from 8 sensor heads, each with different sun-analyzer angles that vary with spacecraft spin phase. Because of the low effective density of instrument photoelectrons compared to the ambient plasma density, they were not considered as significant for this event.
