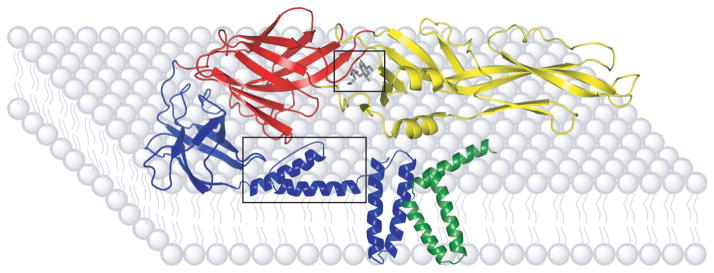
Figure 2.
Sites of DENV E protein Inhibition. The E protein domains are indicated by color; domain I in red, domain II in yellow, and domain III in blue. The relative position of the M protein is indicated by green shading. The β-OG pocket and stem region (boxed) are common sites of E protein targeting. Stem and M protein structure and location determined from secondary structural predictions and cryo-electron microscopy densities. Figure adapted from Modis et al. 2003 (32) copyright National Academy of Sciences, U.S.A. Adapted by permission from Macmillan Publishers Ltd: Nature Structural Biology, Zhang et al. (42), copyright 2003, and Nature Reviews Microbiology, Mukhopadhyay et al. (90), copyright 2005.

