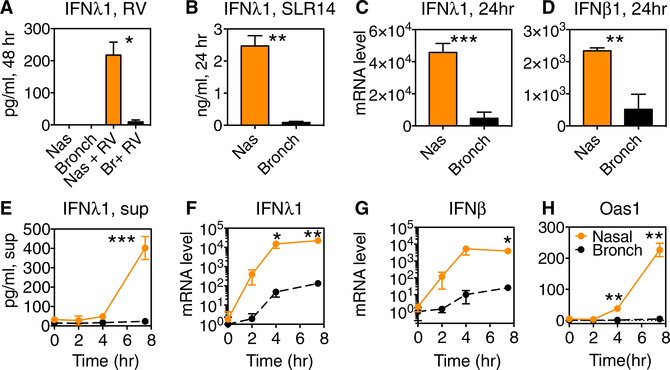
Figure 1. IFNλ1 and ISG Induction in Nasal and Bronchial Epithelial Cells following Rhinovirus Infection or SLR14 Exposure.
(A) Primary nasal and bronchial epithelial cells were inoculated with RV-1B, MOI 0.1, and incubated at 37C for 48 hr, at which time supernatants were collected for ELISA. Bars show IFNl1 protein in supernatant.
(B–H) Primary nasal and bronchial epithelial cells were transfected with RIG-I ligand SLR14 for 1 hr and then medium was added and cells were incubated at 37C. Supernatants were collected for ELISA, and cells were collected for RNA isolation and qRT-PCR at the time points shown.
(B) IFNλ1 in the supernatant was measured by ELISA at 24 hr.
(C and D) Fold change in mRNA for IFNλ1 (C) or IFNβ (D) at 24 hr.
(E) IFNλ1 in the supernatant was measured by ELISA at 0–8 hr.
(F–H) Fold change in mRNA for IFNλ1 (F), IFNβ (G), and Oas1(H) at time points 0–8 hr post-stimulation. Bars represent mean and SD of 2 or 3 replicate experimental wells per condition. mRNA level is plotted relative to the level in resting bronchial cells (t = 0 hr).
Data are representative of at least 3 independent experiments with airway epithelial cells of each type from two or more different donors. Significant differences between nasal and bronchial cell levels by paired t test are shown with asterisks: ***p < 0.0005; **p < 0.005; and *p < 0.05.
See also Figure S1.

