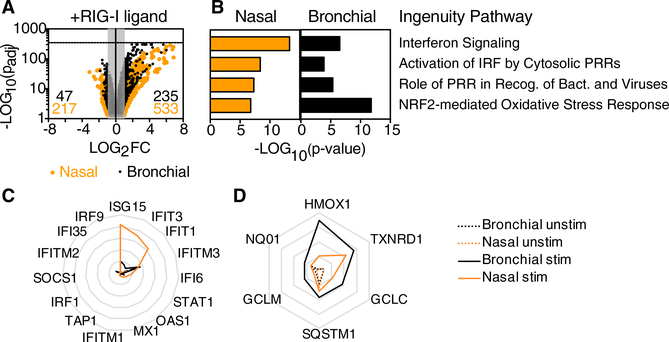
Figure 2. Transcriptome Changes in Response to RIG-I Ligand in Human Nasal and Bronchial Airway Epithelial Cells.
RNA-seq was performed on RNA isolated from two replicate wells of stimulated and unstimulated nasal or bronchial epithelial cells (total of eight samples) following SLR14 stimulation (for 1 hr) followed by incubation for 7 hr at 37°C. Libraries were prepared for paired-end RNA sequencing from two replicate samples per condition.
(A) Dot plot depicts change in expression levels for all transcripts in stimulated versus unstimulated cells. Dots outside the gray box represent tran-scripts significantly increased (235 for bronchial; 533 for nasal) or decreased (47 for bronchial; 217 for nasal) in response to SLR14 stimulation (Log2FC > 1 or Log2FC < −1; p-adj < 0.05).
(B) Bar graph shows p values associated with top four ingenuity pathways enriched in response to SLR14 stimulation in both cell types (Z score > 1; p < 0.01).
(C and D) Radar plots show average fragments per kilobase mapped (FPKM) for transcripts contributing to the “interferon signaling” ingenuity pathway (C) or for antioxidant enzymes associated with the NRF2-mediated oxidative stress response ingenuity pathway (D) in SLR14-stimulated (solid line) and unstimulated (dashed line) cells. Gridlines in (C) range from 0 to 500 FPKM (intervals of 100) and gridlines in (D) range from 0 to 200 FPKM (intervals of 50). Throughout, orange lines represent nasal cells and black lines represent bronchial cells.

